Spaniard vs Cheyenne Per Capita Income
COMPARE
Spaniard
Cheyenne
Per Capita Income
Per Capita Income Comparison
Spaniards
Cheyenne
$43,028
PER CAPITA INCOME
32.9/ 100
METRIC RATING
184th/ 347
METRIC RANK
$35,276
PER CAPITA INCOME
0.0/ 100
METRIC RATING
323rd/ 347
METRIC RANK
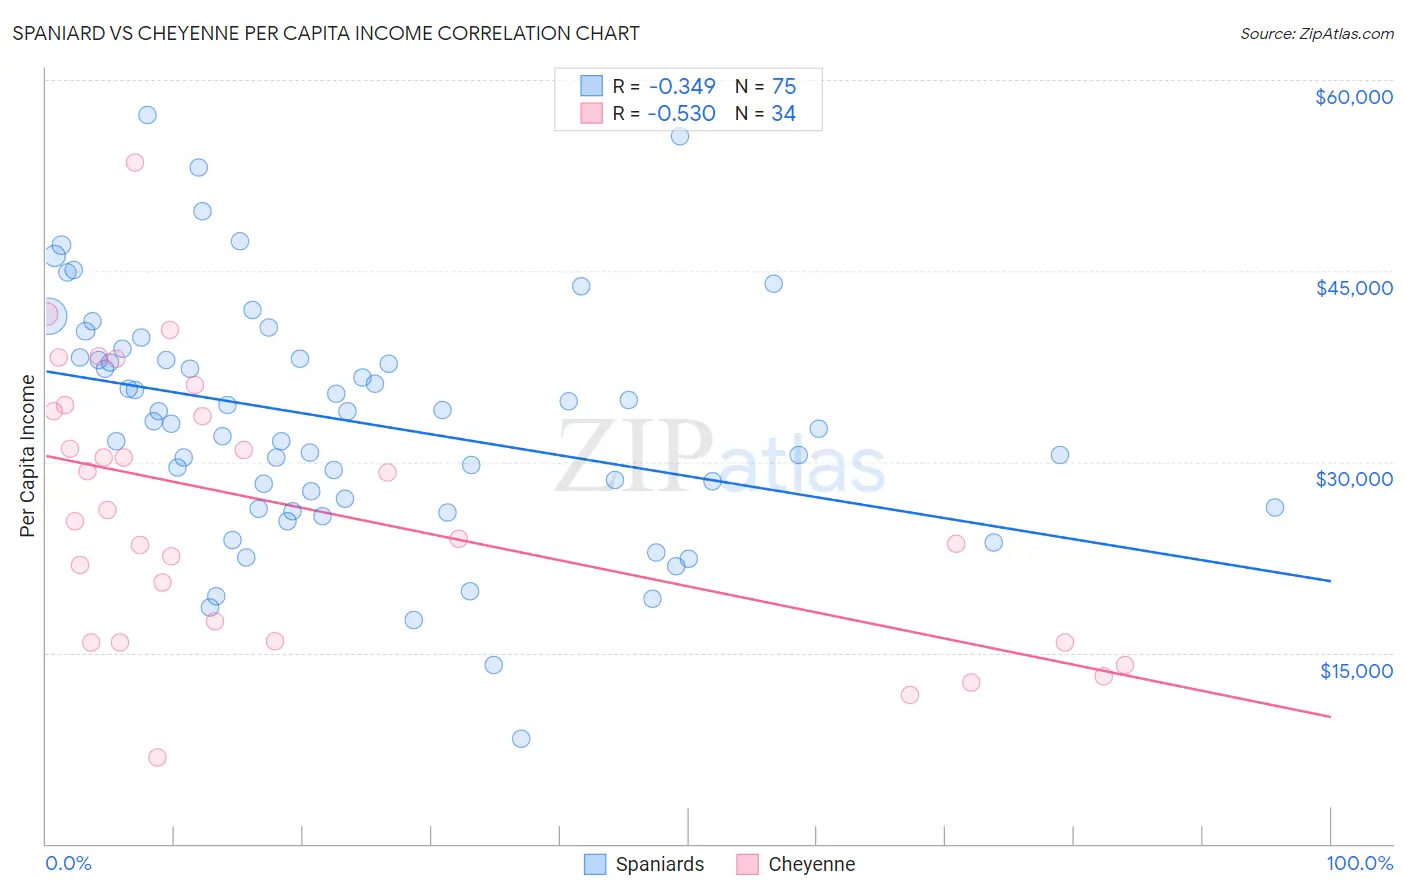
Spaniard vs Cheyenne Per Capita Income Correlation Chart
The statistical analysis conducted on geographies consisting of 443,584,156 people shows a mild negative correlation between the proportion of Spaniards and per capita income in the United States with a correlation coefficient (R) of -0.349 and weighted average of $43,028. Similarly, the statistical analysis conducted on geographies consisting of 80,722,590 people shows a substantial negative correlation between the proportion of Cheyenne and per capita income in the United States with a correlation coefficient (R) of -0.530 and weighted average of $35,276, a difference of 22.0%.
Per Capita Income Correlation Summary
| Measurement | Spaniard | Cheyenne |
| Minimum | $8,290 | $6,772 |
| Maximum | $57,272 | $53,471 |
| Range | $48,982 | $46,699 |
| Mean | $33,214 | $26,352 |
| Median | $33,192 | $25,776 |
| Interquartile 25% (IQ1) | $26,374 | $15,918 |
| Interquartile 75% (IQ3) | $38,222 | $33,955 |
| Interquartile Range (IQR) | $11,848 | $18,037 |
| Standard Deviation (Sample) | $9,446 | $10,544 |
| Standard Deviation (Population) | $9,383 | $10,388 |
Similar Demographics by Per Capita Income
Demographics Similar to Spaniards by Per Capita Income
In terms of per capita income, the demographic groups most similar to Spaniards are Immigrants ($43,010, a difference of 0.040%), French Canadian ($43,003, a difference of 0.060%), German ($43,067, a difference of 0.090%), Immigrants from Colombia ($42,971, a difference of 0.13%), and Immigrants from Africa ($42,950, a difference of 0.18%).
| Demographics | Rating | Rank | Per Capita Income |
| Tlingit-Haida | 45.9 /100 | #177 | Average $43,516 |
| Immigrants | Costa Rica | 44.5 /100 | #178 | Average $43,464 |
| Finns | 44.4 /100 | #179 | Average $43,461 |
| Sierra Leoneans | 42.9 /100 | #180 | Average $43,405 |
| Welsh | 38.2 /100 | #181 | Fair $43,233 |
| Immigrants | Vietnam | 38.1 /100 | #182 | Fair $43,229 |
| Germans | 33.9 /100 | #183 | Fair $43,067 |
| Spaniards | 32.9 /100 | #184 | Fair $43,028 |
| Immigrants | Immigrants | 32.5 /100 | #185 | Fair $43,010 |
| French Canadians | 32.3 /100 | #186 | Fair $43,003 |
| Immigrants | Colombia | 31.5 /100 | #187 | Fair $42,971 |
| Immigrants | Africa | 31.0 /100 | #188 | Fair $42,950 |
| Bermudans | 30.1 /100 | #189 | Fair $42,911 |
| Kenyans | 27.7 /100 | #190 | Fair $42,808 |
| Yugoslavians | 27.4 /100 | #191 | Fair $42,792 |
Demographics Similar to Cheyenne by Per Capita Income
In terms of per capita income, the demographic groups most similar to Cheyenne are Kiowa ($35,102, a difference of 0.50%), Creek ($35,546, a difference of 0.76%), Black/African American ($35,564, a difference of 0.82%), Immigrants from Central America ($34,974, a difference of 0.87%), and Immigrants from Cuba ($34,910, a difference of 1.1%).
| Demographics | Rating | Rank | Per Capita Income |
| Choctaw | 0.0 /100 | #316 | Tragic $35,999 |
| Dutch West Indians | 0.0 /100 | #317 | Tragic $35,922 |
| Bangladeshis | 0.0 /100 | #318 | Tragic $35,897 |
| Immigrants | Congo | 0.0 /100 | #319 | Tragic $35,720 |
| Hispanics or Latinos | 0.0 /100 | #320 | Tragic $35,688 |
| Blacks/African Americans | 0.0 /100 | #321 | Tragic $35,564 |
| Creek | 0.0 /100 | #322 | Tragic $35,546 |
| Cheyenne | 0.0 /100 | #323 | Tragic $35,276 |
| Kiowa | 0.0 /100 | #324 | Tragic $35,102 |
| Immigrants | Central America | 0.0 /100 | #325 | Tragic $34,974 |
| Immigrants | Cuba | 0.0 /100 | #326 | Tragic $34,910 |
| Apache | 0.0 /100 | #327 | Tragic $34,886 |
| Menominee | 0.0 /100 | #328 | Tragic $34,578 |
| Mexicans | 0.0 /100 | #329 | Tragic $34,559 |
| Spanish American Indians | 0.0 /100 | #330 | Tragic $34,195 |