Spaniard vs Nonimmigrants Per Capita Income
COMPARE
Spaniard
Nonimmigrants
Per Capita Income
Per Capita Income Comparison
Spaniards
Nonimmigrants
$43,028
PER CAPITA INCOME
32.9/ 100
METRIC RATING
184th/ 347
METRIC RANK
$40,669
PER CAPITA INCOME
3.4/ 100
METRIC RATING
236th/ 347
METRIC RANK
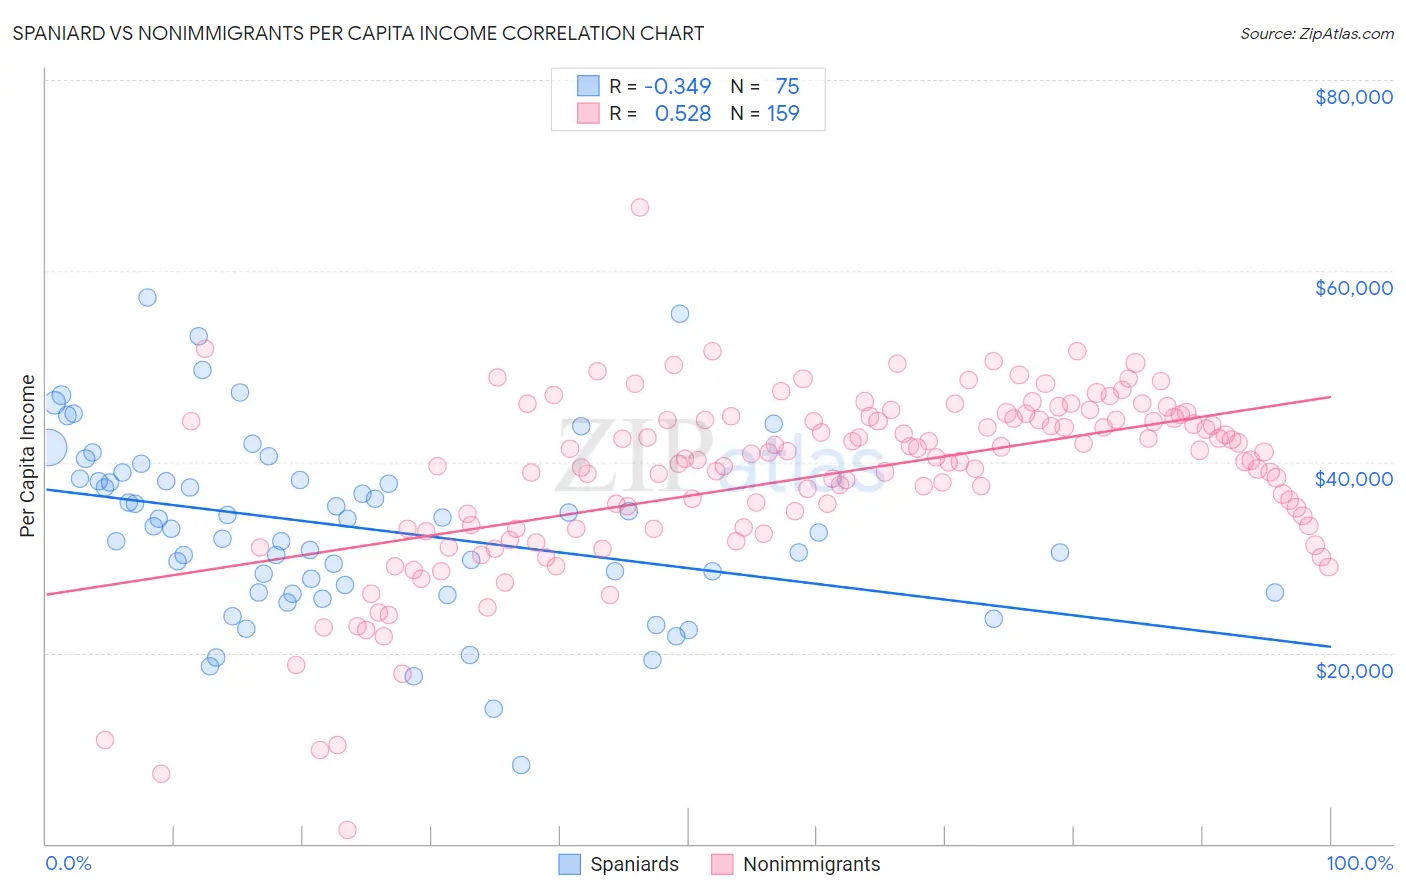
Spaniard vs Nonimmigrants Per Capita Income Correlation Chart
The statistical analysis conducted on geographies consisting of 443,584,156 people shows a mild negative correlation between the proportion of Spaniards and per capita income in the United States with a correlation coefficient (R) of -0.349 and weighted average of $43,028. Similarly, the statistical analysis conducted on geographies consisting of 585,383,873 people shows a substantial positive correlation between the proportion of Nonimmigrants and per capita income in the United States with a correlation coefficient (R) of 0.528 and weighted average of $40,669, a difference of 5.8%.
Per Capita Income Correlation Summary
| Measurement | Spaniard | Nonimmigrants |
| Minimum | $8,290 | $1,397 |
| Maximum | $57,272 | $66,659 |
| Range | $48,982 | $65,262 |
| Mean | $33,214 | $38,443 |
| Median | $33,192 | $40,388 |
| Interquartile 25% (IQ1) | $26,374 | $33,053 |
| Interquartile 75% (IQ3) | $38,222 | $44,574 |
| Interquartile Range (IQR) | $11,848 | $11,521 |
| Standard Deviation (Sample) | $9,446 | $9,433 |
| Standard Deviation (Population) | $9,383 | $9,403 |
Similar Demographics by Per Capita Income
Demographics Similar to Spaniards by Per Capita Income
In terms of per capita income, the demographic groups most similar to Spaniards are Immigrants ($43,010, a difference of 0.040%), French Canadian ($43,003, a difference of 0.060%), German ($43,067, a difference of 0.090%), Immigrants from Colombia ($42,971, a difference of 0.13%), and Immigrants from Africa ($42,950, a difference of 0.18%).
| Demographics | Rating | Rank | Per Capita Income |
| Tlingit-Haida | 45.9 /100 | #177 | Average $43,516 |
| Immigrants | Costa Rica | 44.5 /100 | #178 | Average $43,464 |
| Finns | 44.4 /100 | #179 | Average $43,461 |
| Sierra Leoneans | 42.9 /100 | #180 | Average $43,405 |
| Welsh | 38.2 /100 | #181 | Fair $43,233 |
| Immigrants | Vietnam | 38.1 /100 | #182 | Fair $43,229 |
| Germans | 33.9 /100 | #183 | Fair $43,067 |
| Spaniards | 32.9 /100 | #184 | Fair $43,028 |
| Immigrants | Immigrants | 32.5 /100 | #185 | Fair $43,010 |
| French Canadians | 32.3 /100 | #186 | Fair $43,003 |
| Immigrants | Colombia | 31.5 /100 | #187 | Fair $42,971 |
| Immigrants | Africa | 31.0 /100 | #188 | Fair $42,950 |
| Bermudans | 30.1 /100 | #189 | Fair $42,911 |
| Kenyans | 27.7 /100 | #190 | Fair $42,808 |
| Yugoslavians | 27.4 /100 | #191 | Fair $42,792 |
Demographics Similar to Nonimmigrants by Per Capita Income
In terms of per capita income, the demographic groups most similar to Nonimmigrants are Immigrants from Guyana ($40,742, a difference of 0.18%), Immigrants from West Indies ($40,763, a difference of 0.23%), Delaware ($40,778, a difference of 0.27%), Immigrants from Cambodia ($40,434, a difference of 0.58%), and Guyanese ($40,949, a difference of 0.69%).
| Demographics | Rating | Rank | Per Capita Income |
| Nigerians | 4.9 /100 | #229 | Tragic $41,026 |
| Native Hawaiians | 4.9 /100 | #230 | Tragic $41,017 |
| Senegalese | 4.8 /100 | #231 | Tragic $41,000 |
| Guyanese | 4.5 /100 | #232 | Tragic $40,949 |
| Delaware | 3.8 /100 | #233 | Tragic $40,778 |
| Immigrants | West Indies | 3.7 /100 | #234 | Tragic $40,763 |
| Immigrants | Guyana | 3.6 /100 | #235 | Tragic $40,742 |
| Immigrants | Nonimmigrants | 3.4 /100 | #236 | Tragic $40,669 |
| Immigrants | Cambodia | 2.6 /100 | #237 | Tragic $40,434 |
| Somalis | 2.4 /100 | #238 | Tragic $40,367 |
| Tsimshian | 2.4 /100 | #239 | Tragic $40,344 |
| Immigrants | Nigeria | 2.3 /100 | #240 | Tragic $40,339 |
| British West Indians | 2.3 /100 | #241 | Tragic $40,330 |
| Immigrants | Western Africa | 2.2 /100 | #242 | Tragic $40,294 |
| German Russians | 2.2 /100 | #243 | Tragic $40,266 |