Spaniard vs Immigrants from Nepal Per Capita Income
COMPARE
Spaniard
Immigrants from Nepal
Per Capita Income
Per Capita Income Comparison
Spaniards
Immigrants from Nepal
$43,028
PER CAPITA INCOME
32.9/ 100
METRIC RATING
184th/ 347
METRIC RANK
$44,187
PER CAPITA INCOME
64.3/ 100
METRIC RATING
158th/ 347
METRIC RANK
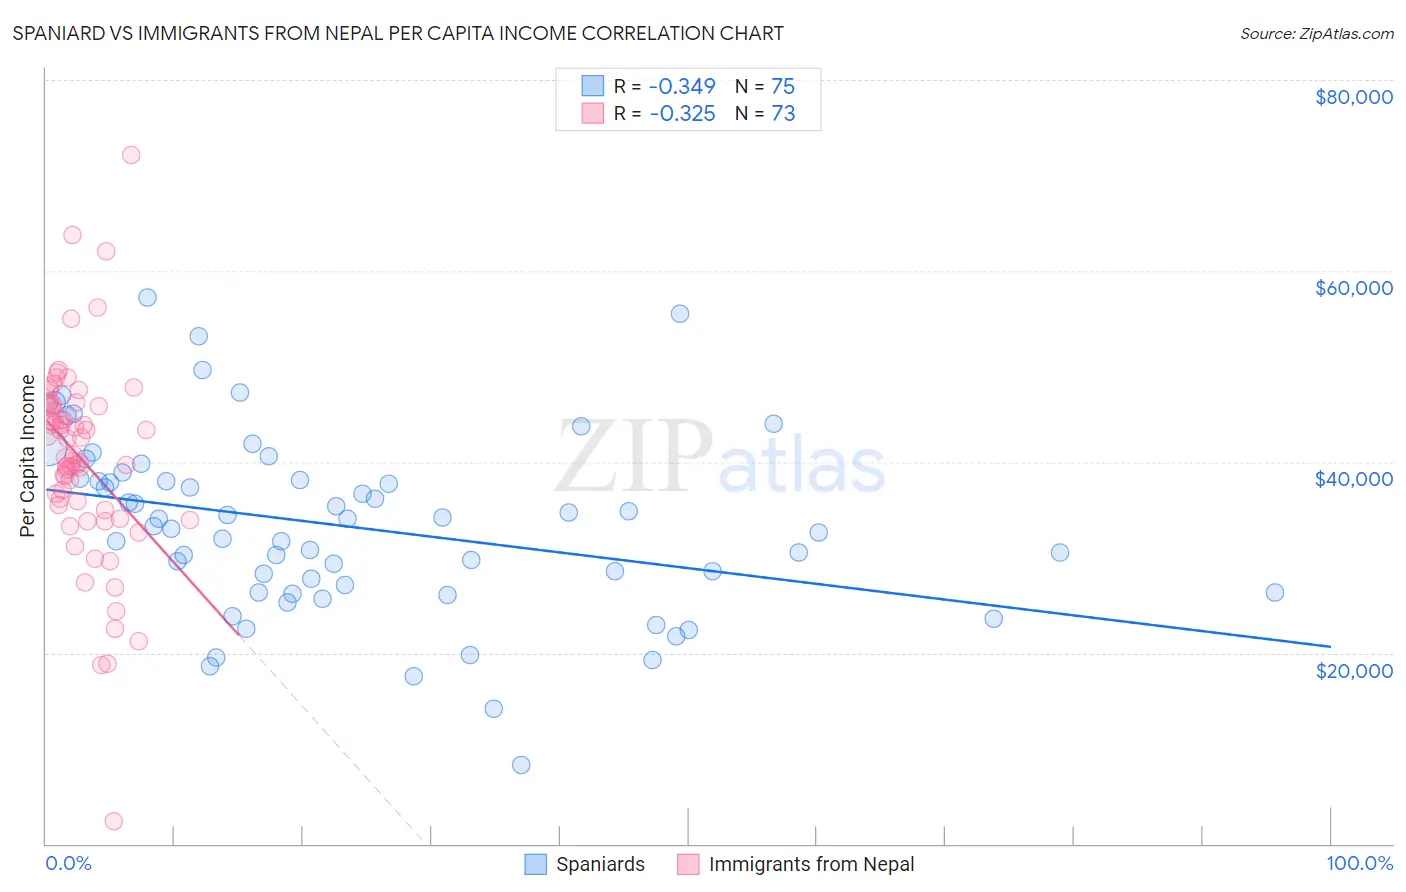
Spaniard vs Immigrants from Nepal Per Capita Income Correlation Chart
The statistical analysis conducted on geographies consisting of 443,584,156 people shows a mild negative correlation between the proportion of Spaniards and per capita income in the United States with a correlation coefficient (R) of -0.349 and weighted average of $43,028. Similarly, the statistical analysis conducted on geographies consisting of 186,792,214 people shows a mild negative correlation between the proportion of Immigrants from Nepal and per capita income in the United States with a correlation coefficient (R) of -0.325 and weighted average of $44,187, a difference of 2.7%.
Per Capita Income Correlation Summary
| Measurement | Spaniard | Immigrants from Nepal |
| Minimum | $8,290 | $2,302 |
| Maximum | $57,272 | $72,138 |
| Range | $48,982 | $69,836 |
| Mean | $33,214 | $40,351 |
| Median | $33,192 | $40,773 |
| Interquartile 25% (IQ1) | $26,374 | $35,186 |
| Interquartile 75% (IQ3) | $38,222 | $46,005 |
| Interquartile Range (IQR) | $11,848 | $10,819 |
| Standard Deviation (Sample) | $9,446 | $10,460 |
| Standard Deviation (Population) | $9,383 | $10,388 |
Similar Demographics by Per Capita Income
Demographics Similar to Spaniards by Per Capita Income
In terms of per capita income, the demographic groups most similar to Spaniards are Immigrants ($43,010, a difference of 0.040%), French Canadian ($43,003, a difference of 0.060%), German ($43,067, a difference of 0.090%), Immigrants from Colombia ($42,971, a difference of 0.13%), and Immigrants from Africa ($42,950, a difference of 0.18%).
| Demographics | Rating | Rank | Per Capita Income |
| Tlingit-Haida | 45.9 /100 | #177 | Average $43,516 |
| Immigrants | Costa Rica | 44.5 /100 | #178 | Average $43,464 |
| Finns | 44.4 /100 | #179 | Average $43,461 |
| Sierra Leoneans | 42.9 /100 | #180 | Average $43,405 |
| Welsh | 38.2 /100 | #181 | Fair $43,233 |
| Immigrants | Vietnam | 38.1 /100 | #182 | Fair $43,229 |
| Germans | 33.9 /100 | #183 | Fair $43,067 |
| Spaniards | 32.9 /100 | #184 | Fair $43,028 |
| Immigrants | Immigrants | 32.5 /100 | #185 | Fair $43,010 |
| French Canadians | 32.3 /100 | #186 | Fair $43,003 |
| Immigrants | Colombia | 31.5 /100 | #187 | Fair $42,971 |
| Immigrants | Africa | 31.0 /100 | #188 | Fair $42,950 |
| Bermudans | 30.1 /100 | #189 | Fair $42,911 |
| Kenyans | 27.7 /100 | #190 | Fair $42,808 |
| Yugoslavians | 27.4 /100 | #191 | Fair $42,792 |
Demographics Similar to Immigrants from Nepal by Per Capita Income
In terms of per capita income, the demographic groups most similar to Immigrants from Nepal are South American Indian ($44,206, a difference of 0.040%), Slovak ($44,229, a difference of 0.090%), South American ($44,114, a difference of 0.17%), Danish ($44,095, a difference of 0.21%), and Costa Rican ($44,090, a difference of 0.22%).
| Demographics | Rating | Rank | Per Capita Income |
| Norwegians | 71.5 /100 | #151 | Good $44,480 |
| Peruvians | 71.5 /100 | #152 | Good $44,479 |
| Scottish | 70.6 /100 | #153 | Good $44,440 |
| Portuguese | 68.7 /100 | #154 | Good $44,362 |
| Uruguayans | 67.6 /100 | #155 | Good $44,318 |
| Slovaks | 65.4 /100 | #156 | Good $44,229 |
| South American Indians | 64.8 /100 | #157 | Good $44,206 |
| Immigrants | Nepal | 64.3 /100 | #158 | Good $44,187 |
| South Americans | 62.4 /100 | #159 | Good $44,114 |
| Danes | 61.9 /100 | #160 | Good $44,095 |
| Costa Ricans | 61.8 /100 | #161 | Good $44,090 |
| Swiss | 61.4 /100 | #162 | Good $44,076 |
| Immigrants | South America | 61.2 /100 | #163 | Good $44,068 |
| Sri Lankans | 59.8 /100 | #164 | Average $44,014 |
| Immigrants | Philippines | 59.4 /100 | #165 | Average $44,000 |