Immigrants from Oceania vs Cheyenne Per Capita Income
COMPARE
Immigrants from Oceania
Cheyenne
Per Capita Income
Per Capita Income Comparison
Immigrants from Oceania
Cheyenne
$45,220
PER CAPITA INCOME
85.2/ 100
METRIC RATING
136th/ 347
METRIC RANK
$35,276
PER CAPITA INCOME
0.0/ 100
METRIC RATING
323rd/ 347
METRIC RANK
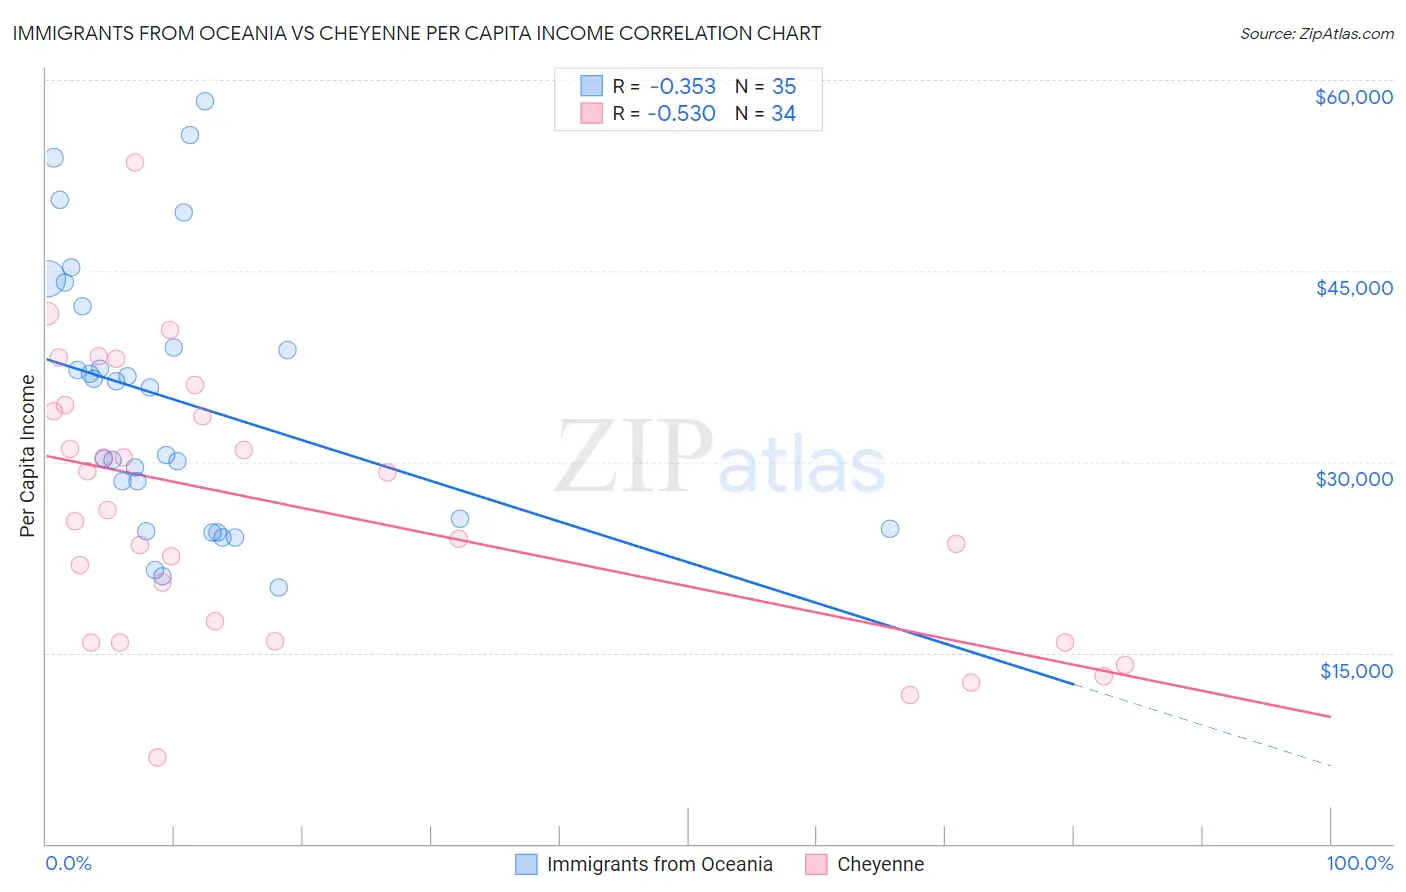
Immigrants from Oceania vs Cheyenne Per Capita Income Correlation Chart
The statistical analysis conducted on geographies consisting of 305,528,367 people shows a mild negative correlation between the proportion of Immigrants from Oceania and per capita income in the United States with a correlation coefficient (R) of -0.353 and weighted average of $45,220. Similarly, the statistical analysis conducted on geographies consisting of 80,722,590 people shows a substantial negative correlation between the proportion of Cheyenne and per capita income in the United States with a correlation coefficient (R) of -0.530 and weighted average of $35,276, a difference of 28.2%.
Per Capita Income Correlation Summary
| Measurement | Immigrants from Oceania | Cheyenne |
| Minimum | $20,128 | $6,772 |
| Maximum | $58,378 | $53,471 |
| Range | $38,250 | $46,699 |
| Mean | $34,877 | $26,352 |
| Median | $35,881 | $25,776 |
| Interquartile 25% (IQ1) | $24,699 | $15,918 |
| Interquartile 75% (IQ3) | $42,218 | $33,955 |
| Interquartile Range (IQR) | $17,519 | $18,037 |
| Standard Deviation (Sample) | $10,480 | $10,544 |
| Standard Deviation (Population) | $10,330 | $10,388 |
Similar Demographics by Per Capita Income
Demographics Similar to Immigrants from Oceania by Per Capita Income
In terms of per capita income, the demographic groups most similar to Immigrants from Oceania are Immigrants from Syria ($45,218, a difference of 0.0%), Assyrian/Chaldean/Syriac ($45,195, a difference of 0.060%), Basque ($45,086, a difference of 0.30%), Immigrants from Jordan ($45,066, a difference of 0.34%), and Slavic ($45,049, a difference of 0.38%).
| Demographics | Rating | Rank | Per Capita Income |
| Luxembourgers | 90.4 /100 | #129 | Exceptional $45,663 |
| Arabs | 90.4 /100 | #130 | Exceptional $45,662 |
| Immigrants | North Macedonia | 90.0 /100 | #131 | Exceptional $45,622 |
| Jordanians | 89.9 /100 | #132 | Excellent $45,605 |
| Pakistanis | 89.7 /100 | #133 | Excellent $45,587 |
| Slovenes | 89.6 /100 | #134 | Excellent $45,581 |
| Hungarians | 87.9 /100 | #135 | Excellent $45,426 |
| Immigrants | Oceania | 85.2 /100 | #136 | Excellent $45,220 |
| Immigrants | Syria | 85.2 /100 | #137 | Excellent $45,218 |
| Assyrians/Chaldeans/Syriacs | 84.8 /100 | #138 | Excellent $45,195 |
| Basques | 83.2 /100 | #139 | Excellent $45,086 |
| Immigrants | Jordan | 82.9 /100 | #140 | Excellent $45,066 |
| Slavs | 82.6 /100 | #141 | Excellent $45,049 |
| Ugandans | 82.6 /100 | #142 | Excellent $45,047 |
| Immigrants | Uganda | 82.5 /100 | #143 | Excellent $45,043 |
Demographics Similar to Cheyenne by Per Capita Income
In terms of per capita income, the demographic groups most similar to Cheyenne are Kiowa ($35,102, a difference of 0.50%), Creek ($35,546, a difference of 0.76%), Black/African American ($35,564, a difference of 0.82%), Immigrants from Central America ($34,974, a difference of 0.87%), and Immigrants from Cuba ($34,910, a difference of 1.1%).
| Demographics | Rating | Rank | Per Capita Income |
| Choctaw | 0.0 /100 | #316 | Tragic $35,999 |
| Dutch West Indians | 0.0 /100 | #317 | Tragic $35,922 |
| Bangladeshis | 0.0 /100 | #318 | Tragic $35,897 |
| Immigrants | Congo | 0.0 /100 | #319 | Tragic $35,720 |
| Hispanics or Latinos | 0.0 /100 | #320 | Tragic $35,688 |
| Blacks/African Americans | 0.0 /100 | #321 | Tragic $35,564 |
| Creek | 0.0 /100 | #322 | Tragic $35,546 |
| Cheyenne | 0.0 /100 | #323 | Tragic $35,276 |
| Kiowa | 0.0 /100 | #324 | Tragic $35,102 |
| Immigrants | Central America | 0.0 /100 | #325 | Tragic $34,974 |
| Immigrants | Cuba | 0.0 /100 | #326 | Tragic $34,910 |
| Apache | 0.0 /100 | #327 | Tragic $34,886 |
| Menominee | 0.0 /100 | #328 | Tragic $34,578 |
| Mexicans | 0.0 /100 | #329 | Tragic $34,559 |
| Spanish American Indians | 0.0 /100 | #330 | Tragic $34,195 |