Immigrants from Iraq vs Cheyenne Per Capita Income
COMPARE
Immigrants from Iraq
Cheyenne
Per Capita Income
Per Capita Income Comparison
Immigrants from Iraq
Cheyenne
$41,365
PER CAPITA INCOME
7.1/ 100
METRIC RATING
222nd/ 347
METRIC RANK
$35,276
PER CAPITA INCOME
0.0/ 100
METRIC RATING
323rd/ 347
METRIC RANK
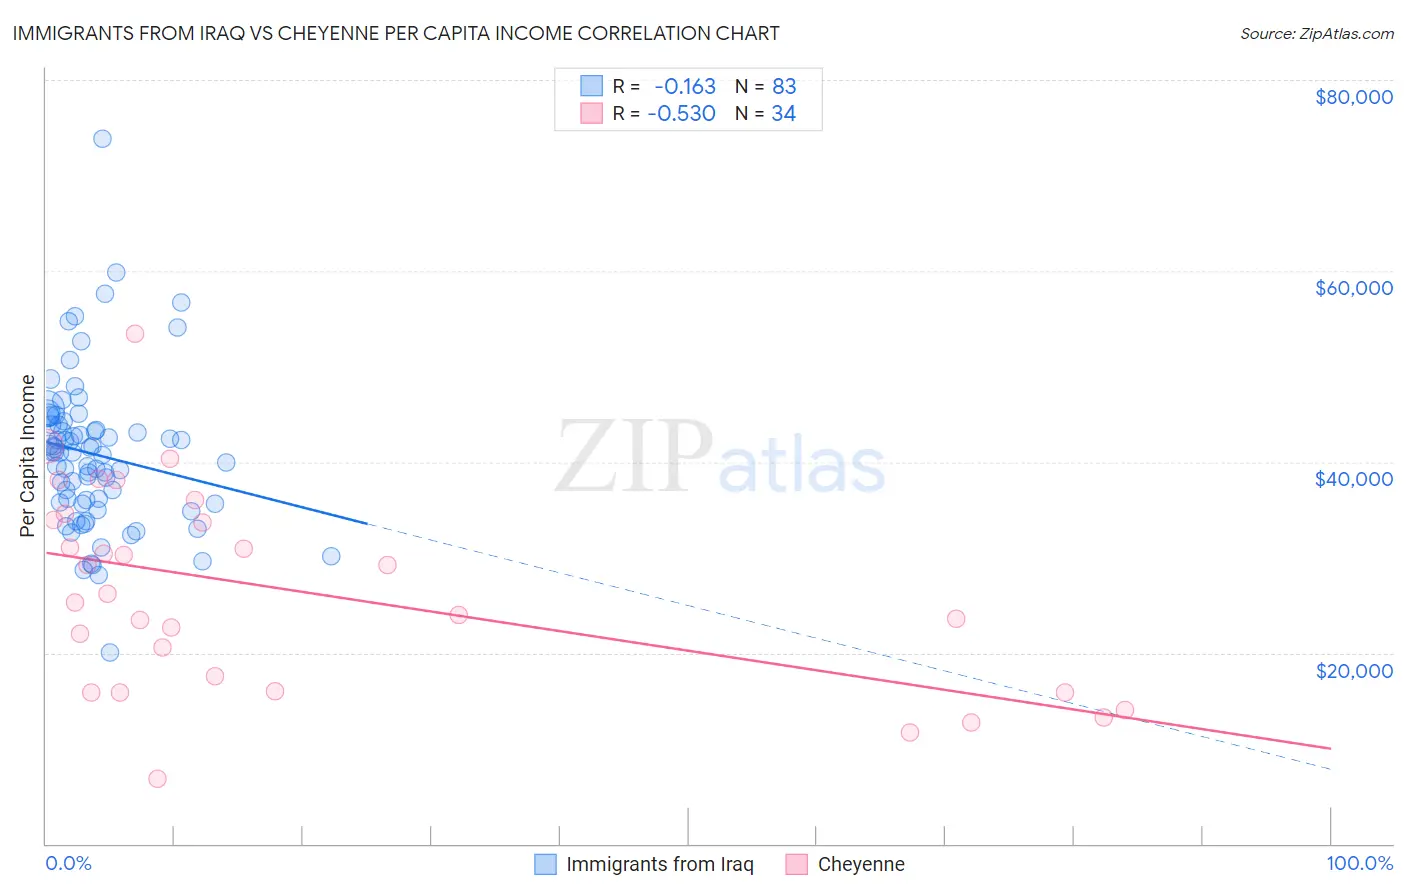
Immigrants from Iraq vs Cheyenne Per Capita Income Correlation Chart
The statistical analysis conducted on geographies consisting of 194,781,264 people shows a poor negative correlation between the proportion of Immigrants from Iraq and per capita income in the United States with a correlation coefficient (R) of -0.163 and weighted average of $41,365. Similarly, the statistical analysis conducted on geographies consisting of 80,722,590 people shows a substantial negative correlation between the proportion of Cheyenne and per capita income in the United States with a correlation coefficient (R) of -0.530 and weighted average of $35,276, a difference of 17.3%.
Per Capita Income Correlation Summary
| Measurement | Immigrants from Iraq | Cheyenne |
| Minimum | $19,973 | $6,772 |
| Maximum | $73,810 | $53,471 |
| Range | $53,837 | $46,699 |
| Mean | $40,767 | $26,352 |
| Median | $40,988 | $25,776 |
| Interquartile 25% (IQ1) | $35,615 | $15,918 |
| Interquartile 75% (IQ3) | $43,922 | $33,955 |
| Interquartile Range (IQR) | $8,307 | $18,037 |
| Standard Deviation (Sample) | $8,068 | $10,544 |
| Standard Deviation (Population) | $8,019 | $10,388 |
Similar Demographics by Per Capita Income
Demographics Similar to Immigrants from Iraq by Per Capita Income
In terms of per capita income, the demographic groups most similar to Immigrants from Iraq are Immigrants from Cameroon ($41,334, a difference of 0.070%), Immigrants from St. Vincent and the Grenadines ($41,270, a difference of 0.23%), Immigrants from Barbados ($41,478, a difference of 0.27%), Immigrants from Trinidad and Tobago ($41,476, a difference of 0.27%), and Puget Sound Salish ($41,495, a difference of 0.31%).
| Demographics | Rating | Rank | Per Capita Income |
| Sudanese | 9.9 /100 | #215 | Tragic $41,695 |
| Tongans | 9.9 /100 | #216 | Tragic $41,693 |
| Guamanians/Chamorros | 9.7 /100 | #217 | Tragic $41,678 |
| Trinidadians and Tobagonians | 9.5 /100 | #218 | Tragic $41,655 |
| Puget Sound Salish | 8.1 /100 | #219 | Tragic $41,495 |
| Immigrants | Barbados | 7.9 /100 | #220 | Tragic $41,478 |
| Immigrants | Trinidad and Tobago | 7.9 /100 | #221 | Tragic $41,476 |
| Immigrants | Iraq | 7.1 /100 | #222 | Tragic $41,365 |
| Immigrants | Cameroon | 6.8 /100 | #223 | Tragic $41,334 |
| Immigrants | St. Vincent and the Grenadines | 6.4 /100 | #224 | Tragic $41,270 |
| West Indians | 6.0 /100 | #225 | Tragic $41,217 |
| Immigrants | Ecuador | 5.9 /100 | #226 | Tragic $41,195 |
| Immigrants | Ghana | 5.5 /100 | #227 | Tragic $41,131 |
| Immigrants | Grenada | 5.5 /100 | #228 | Tragic $41,123 |
| Nigerians | 4.9 /100 | #229 | Tragic $41,026 |
Demographics Similar to Cheyenne by Per Capita Income
In terms of per capita income, the demographic groups most similar to Cheyenne are Kiowa ($35,102, a difference of 0.50%), Creek ($35,546, a difference of 0.76%), Black/African American ($35,564, a difference of 0.82%), Immigrants from Central America ($34,974, a difference of 0.87%), and Immigrants from Cuba ($34,910, a difference of 1.1%).
| Demographics | Rating | Rank | Per Capita Income |
| Choctaw | 0.0 /100 | #316 | Tragic $35,999 |
| Dutch West Indians | 0.0 /100 | #317 | Tragic $35,922 |
| Bangladeshis | 0.0 /100 | #318 | Tragic $35,897 |
| Immigrants | Congo | 0.0 /100 | #319 | Tragic $35,720 |
| Hispanics or Latinos | 0.0 /100 | #320 | Tragic $35,688 |
| Blacks/African Americans | 0.0 /100 | #321 | Tragic $35,564 |
| Creek | 0.0 /100 | #322 | Tragic $35,546 |
| Cheyenne | 0.0 /100 | #323 | Tragic $35,276 |
| Kiowa | 0.0 /100 | #324 | Tragic $35,102 |
| Immigrants | Central America | 0.0 /100 | #325 | Tragic $34,974 |
| Immigrants | Cuba | 0.0 /100 | #326 | Tragic $34,910 |
| Apache | 0.0 /100 | #327 | Tragic $34,886 |
| Menominee | 0.0 /100 | #328 | Tragic $34,578 |
| Mexicans | 0.0 /100 | #329 | Tragic $34,559 |
| Spanish American Indians | 0.0 /100 | #330 | Tragic $34,195 |