Spaniard vs Immigrants from Ireland Per Capita Income
COMPARE
Spaniard
Immigrants from Ireland
Per Capita Income
Per Capita Income Comparison
Spaniards
Immigrants from Ireland
$43,028
PER CAPITA INCOME
32.9/ 100
METRIC RATING
184th/ 347
METRIC RANK
$56,584
PER CAPITA INCOME
100.0/ 100
METRIC RATING
9th/ 347
METRIC RANK
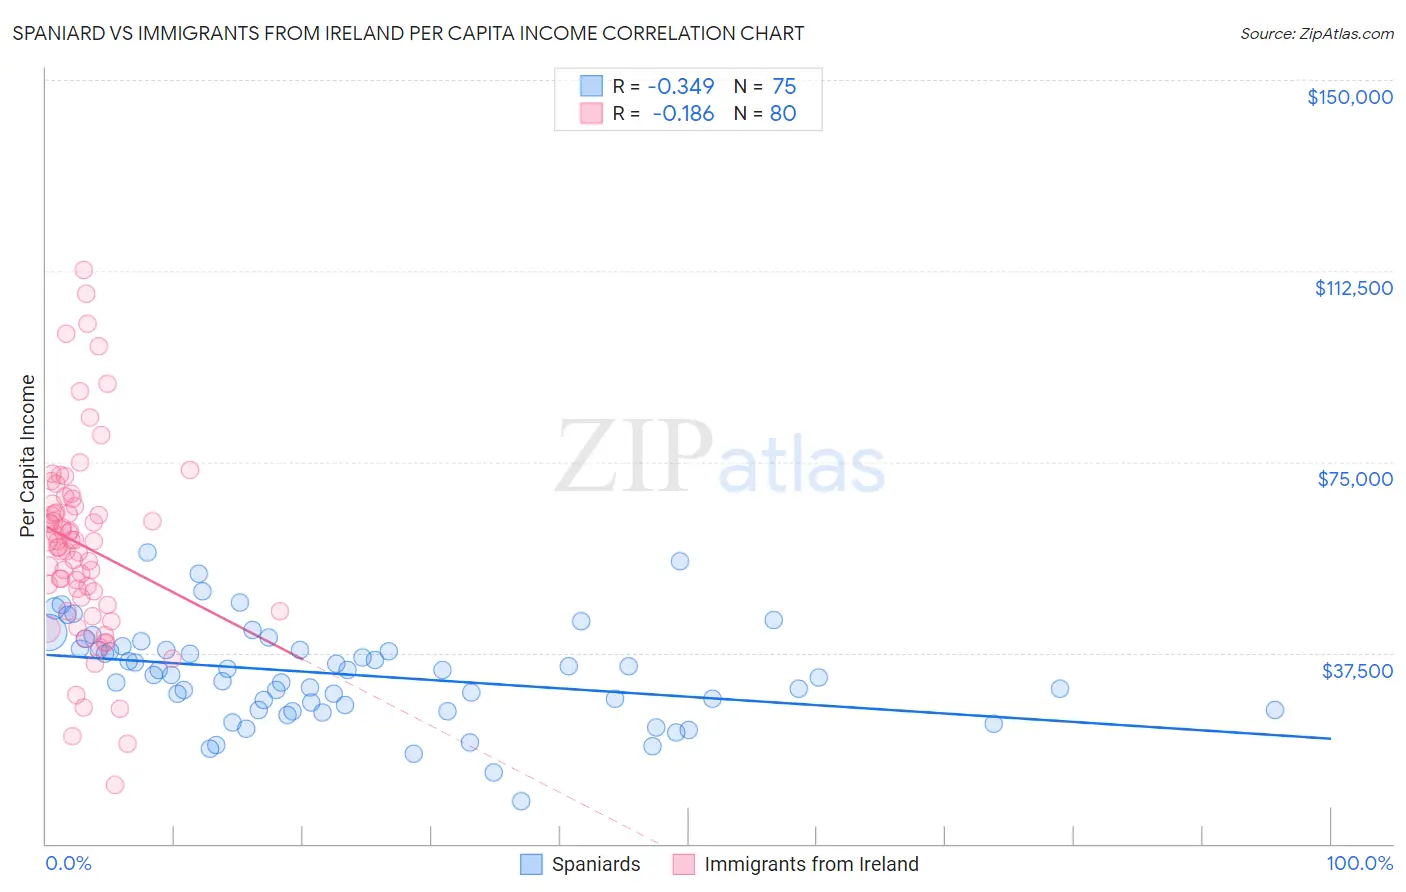
Spaniard vs Immigrants from Ireland Per Capita Income Correlation Chart
The statistical analysis conducted on geographies consisting of 443,584,156 people shows a mild negative correlation between the proportion of Spaniards and per capita income in the United States with a correlation coefficient (R) of -0.349 and weighted average of $43,028. Similarly, the statistical analysis conducted on geographies consisting of 240,778,427 people shows a poor negative correlation between the proportion of Immigrants from Ireland and per capita income in the United States with a correlation coefficient (R) of -0.186 and weighted average of $56,584, a difference of 31.5%.
Per Capita Income Correlation Summary
| Measurement | Spaniard | Immigrants from Ireland |
| Minimum | $8,290 | $11,481 |
| Maximum | $57,272 | $112,628 |
| Range | $48,982 | $101,147 |
| Mean | $33,214 | $58,619 |
| Median | $33,192 | $59,294 |
| Interquartile 25% (IQ1) | $26,374 | $47,629 |
| Interquartile 75% (IQ3) | $38,222 | $66,537 |
| Interquartile Range (IQR) | $11,848 | $18,908 |
| Standard Deviation (Sample) | $9,446 | $19,021 |
| Standard Deviation (Population) | $9,383 | $18,902 |
Similar Demographics by Per Capita Income
Demographics Similar to Spaniards by Per Capita Income
In terms of per capita income, the demographic groups most similar to Spaniards are Immigrants ($43,010, a difference of 0.040%), French Canadian ($43,003, a difference of 0.060%), German ($43,067, a difference of 0.090%), Immigrants from Colombia ($42,971, a difference of 0.13%), and Immigrants from Africa ($42,950, a difference of 0.18%).
| Demographics | Rating | Rank | Per Capita Income |
| Tlingit-Haida | 45.9 /100 | #177 | Average $43,516 |
| Immigrants | Costa Rica | 44.5 /100 | #178 | Average $43,464 |
| Finns | 44.4 /100 | #179 | Average $43,461 |
| Sierra Leoneans | 42.9 /100 | #180 | Average $43,405 |
| Welsh | 38.2 /100 | #181 | Fair $43,233 |
| Immigrants | Vietnam | 38.1 /100 | #182 | Fair $43,229 |
| Germans | 33.9 /100 | #183 | Fair $43,067 |
| Spaniards | 32.9 /100 | #184 | Fair $43,028 |
| Immigrants | Immigrants | 32.5 /100 | #185 | Fair $43,010 |
| French Canadians | 32.3 /100 | #186 | Fair $43,003 |
| Immigrants | Colombia | 31.5 /100 | #187 | Fair $42,971 |
| Immigrants | Africa | 31.0 /100 | #188 | Fair $42,950 |
| Bermudans | 30.1 /100 | #189 | Fair $42,911 |
| Kenyans | 27.7 /100 | #190 | Fair $42,808 |
| Yugoslavians | 27.4 /100 | #191 | Fair $42,792 |
Demographics Similar to Immigrants from Ireland by Per Capita Income
In terms of per capita income, the demographic groups most similar to Immigrants from Ireland are Immigrants from Hong Kong ($56,709, a difference of 0.22%), Okinawan ($55,817, a difference of 1.4%), Immigrants from Israel ($57,384, a difference of 1.4%), Eastern European ($55,780, a difference of 1.4%), and Immigrants from Sweden ($55,582, a difference of 1.8%).
| Demographics | Rating | Rank | Per Capita Income |
| Iranians | 100.0 /100 | #2 | Exceptional $58,786 |
| Immigrants | Singapore | 100.0 /100 | #3 | Exceptional $58,353 |
| Immigrants | Australia | 100.0 /100 | #4 | Exceptional $57,953 |
| Immigrants | Iran | 100.0 /100 | #5 | Exceptional $57,759 |
| Immigrants | Taiwan | 100.0 /100 | #6 | Exceptional $57,742 |
| Immigrants | Israel | 100.0 /100 | #7 | Exceptional $57,384 |
| Immigrants | Hong Kong | 100.0 /100 | #8 | Exceptional $56,709 |
| Immigrants | Ireland | 100.0 /100 | #9 | Exceptional $56,584 |
| Okinawans | 100.0 /100 | #10 | Exceptional $55,817 |
| Eastern Europeans | 100.0 /100 | #11 | Exceptional $55,780 |
| Immigrants | Sweden | 100.0 /100 | #12 | Exceptional $55,582 |
| Immigrants | India | 100.0 /100 | #13 | Exceptional $55,268 |
| Immigrants | Belgium | 100.0 /100 | #14 | Exceptional $55,082 |
| Cypriots | 100.0 /100 | #15 | Exceptional $54,899 |
| Immigrants | Switzerland | 100.0 /100 | #16 | Exceptional $54,866 |