Immigrants from Cuba vs Cheyenne Per Capita Income
COMPARE
Immigrants from Cuba
Cheyenne
Per Capita Income
Per Capita Income Comparison
Immigrants from Cuba
Cheyenne
$34,910
PER CAPITA INCOME
0.0/ 100
METRIC RATING
326th/ 347
METRIC RANK
$35,276
PER CAPITA INCOME
0.0/ 100
METRIC RATING
323rd/ 347
METRIC RANK
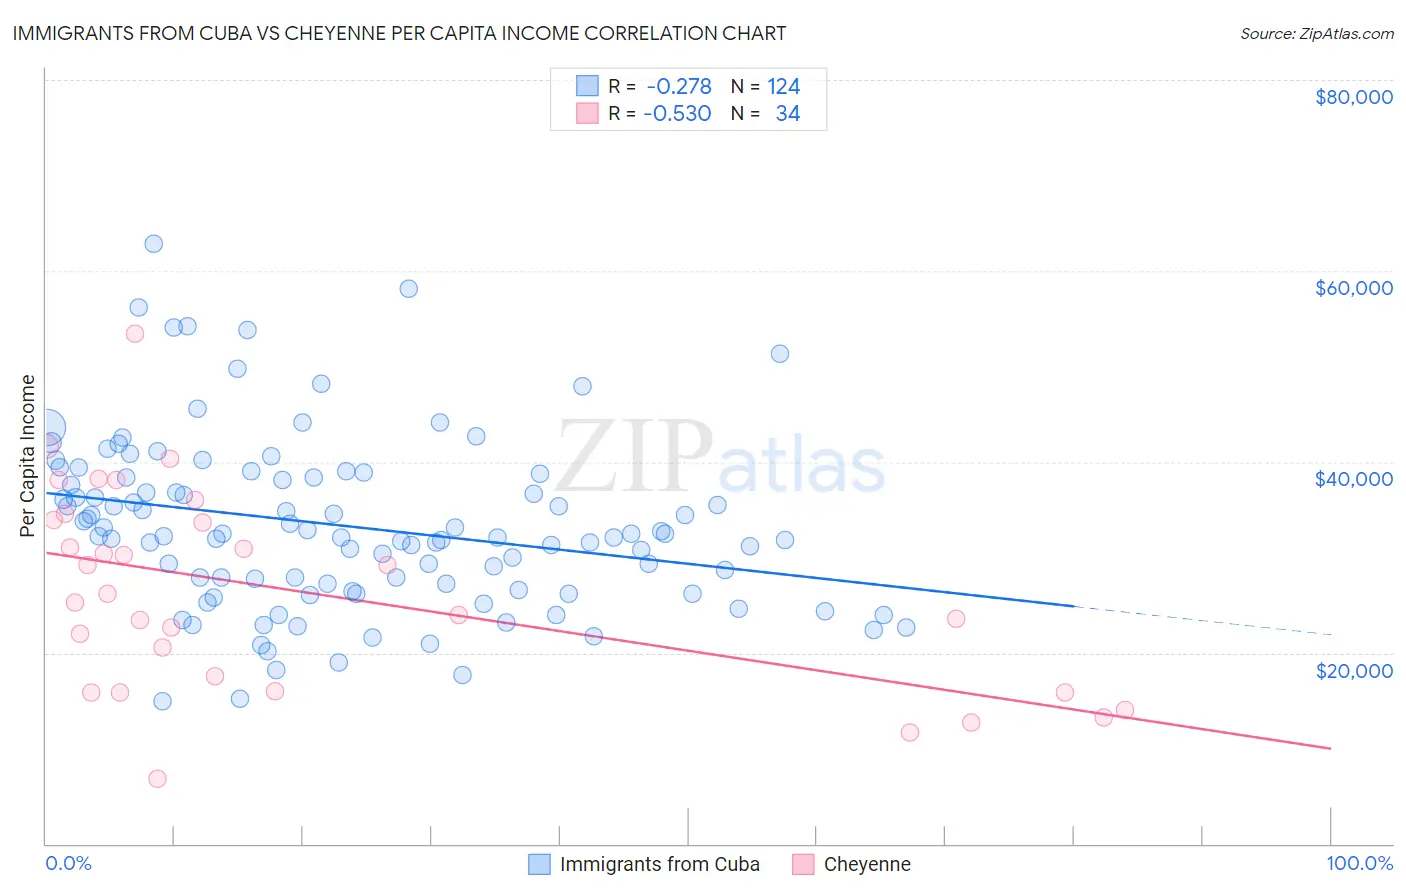
Immigrants from Cuba vs Cheyenne Per Capita Income Correlation Chart
The statistical analysis conducted on geographies consisting of 325,884,272 people shows a weak negative correlation between the proportion of Immigrants from Cuba and per capita income in the United States with a correlation coefficient (R) of -0.278 and weighted average of $34,910. Similarly, the statistical analysis conducted on geographies consisting of 80,722,590 people shows a substantial negative correlation between the proportion of Cheyenne and per capita income in the United States with a correlation coefficient (R) of -0.530 and weighted average of $35,276, a difference of 1.1%.
Per Capita Income Correlation Summary
| Measurement | Immigrants from Cuba | Cheyenne |
| Minimum | $14,936 | $6,772 |
| Maximum | $62,804 | $53,471 |
| Range | $47,868 | $46,699 |
| Mean | $33,273 | $26,352 |
| Median | $32,226 | $25,776 |
| Interquartile 25% (IQ1) | $26,888 | $15,918 |
| Interquartile 75% (IQ3) | $38,343 | $33,955 |
| Interquartile Range (IQR) | $11,455 | $18,037 |
| Standard Deviation (Sample) | $9,025 | $10,544 |
| Standard Deviation (Population) | $8,989 | $10,388 |
Demographics Similar to Immigrants from Cuba and Cheyenne by Per Capita Income
In terms of per capita income, the demographic groups most similar to Immigrants from Cuba are Apache ($34,886, a difference of 0.070%), Immigrants from Central America ($34,974, a difference of 0.18%), Kiowa ($35,102, a difference of 0.55%), Menominee ($34,578, a difference of 0.96%), and Mexican ($34,559, a difference of 1.0%). Similarly, the demographic groups most similar to Cheyenne are Kiowa ($35,102, a difference of 0.50%), Creek ($35,546, a difference of 0.76%), Black/African American ($35,564, a difference of 0.82%), Immigrants from Central America ($34,974, a difference of 0.87%), and Apache ($34,886, a difference of 1.1%).
| Demographics | Rating | Rank | Per Capita Income |
| Seminole | 0.0 /100 | #314 | Tragic $36,180 |
| Yaqui | 0.0 /100 | #315 | Tragic $36,112 |
| Choctaw | 0.0 /100 | #316 | Tragic $35,999 |
| Dutch West Indians | 0.0 /100 | #317 | Tragic $35,922 |
| Bangladeshis | 0.0 /100 | #318 | Tragic $35,897 |
| Immigrants | Congo | 0.0 /100 | #319 | Tragic $35,720 |
| Hispanics or Latinos | 0.0 /100 | #320 | Tragic $35,688 |
| Blacks/African Americans | 0.0 /100 | #321 | Tragic $35,564 |
| Creek | 0.0 /100 | #322 | Tragic $35,546 |
| Cheyenne | 0.0 /100 | #323 | Tragic $35,276 |
| Kiowa | 0.0 /100 | #324 | Tragic $35,102 |
| Immigrants | Central America | 0.0 /100 | #325 | Tragic $34,974 |
| Immigrants | Cuba | 0.0 /100 | #326 | Tragic $34,910 |
| Apache | 0.0 /100 | #327 | Tragic $34,886 |
| Menominee | 0.0 /100 | #328 | Tragic $34,578 |
| Mexicans | 0.0 /100 | #329 | Tragic $34,559 |
| Spanish American Indians | 0.0 /100 | #330 | Tragic $34,195 |
| Immigrants | Mexico | 0.0 /100 | #331 | Tragic $33,931 |
| Sioux | 0.0 /100 | #332 | Tragic $33,921 |
| Immigrants | Yemen | 0.0 /100 | #333 | Tragic $33,696 |
| Natives/Alaskans | 0.0 /100 | #334 | Tragic $33,279 |