Spaniard vs Immigrants from Bulgaria Per Capita Income
COMPARE
Spaniard
Immigrants from Bulgaria
Per Capita Income
Per Capita Income Comparison
Spaniards
Immigrants from Bulgaria
$43,028
PER CAPITA INCOME
32.9/ 100
METRIC RATING
184th/ 347
METRIC RANK
$49,482
PER CAPITA INCOME
99.9/ 100
METRIC RATING
66th/ 347
METRIC RANK
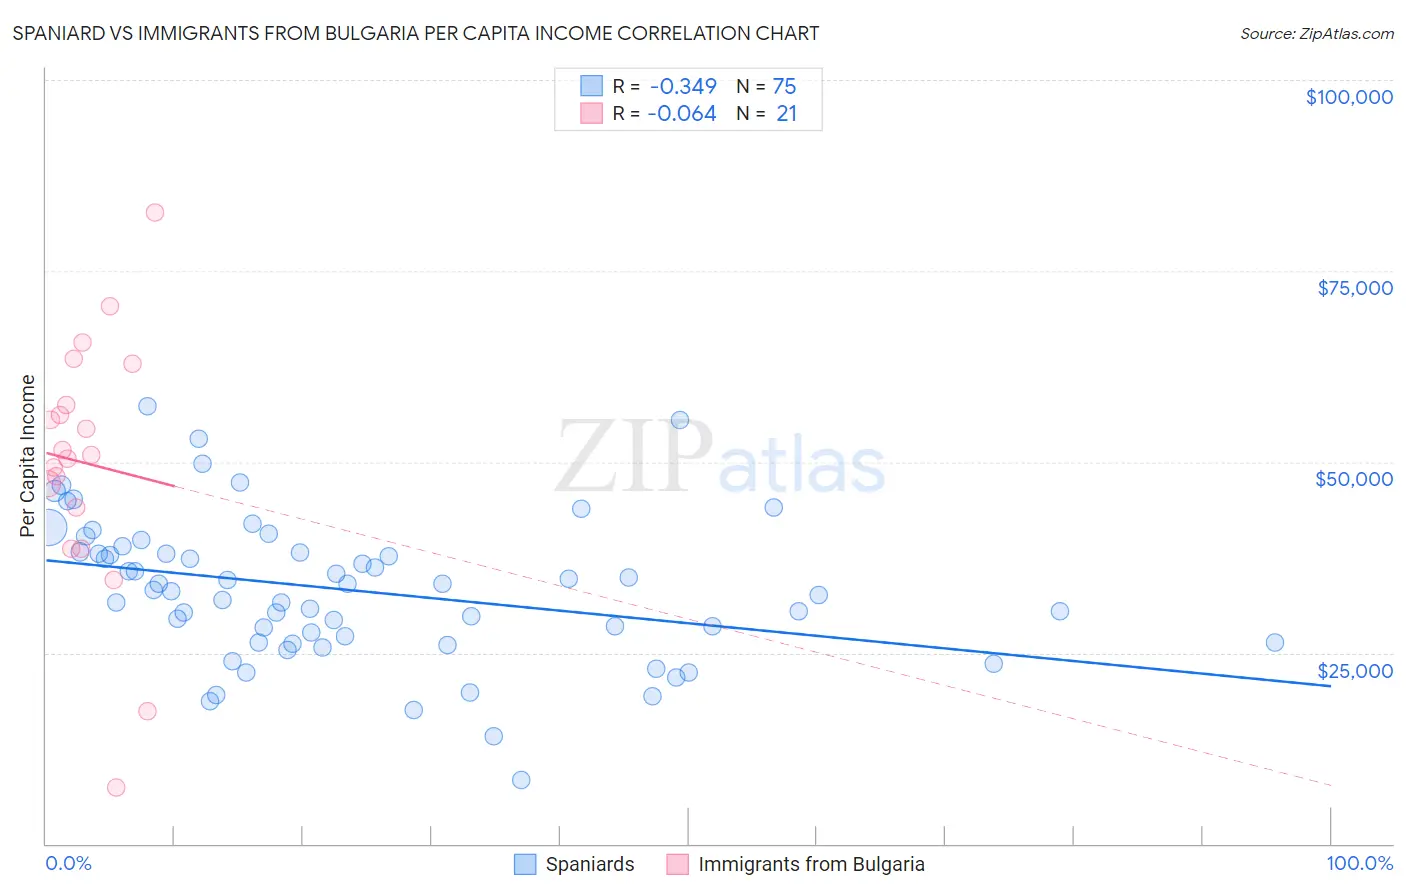
Spaniard vs Immigrants from Bulgaria Per Capita Income Correlation Chart
The statistical analysis conducted on geographies consisting of 443,584,156 people shows a mild negative correlation between the proportion of Spaniards and per capita income in the United States with a correlation coefficient (R) of -0.349 and weighted average of $43,028. Similarly, the statistical analysis conducted on geographies consisting of 172,552,113 people shows a slight negative correlation between the proportion of Immigrants from Bulgaria and per capita income in the United States with a correlation coefficient (R) of -0.064 and weighted average of $49,482, a difference of 15.0%.
Per Capita Income Correlation Summary
| Measurement | Spaniard | Immigrants from Bulgaria |
| Minimum | $8,290 | $7,295 |
| Maximum | $57,272 | $82,704 |
| Range | $48,982 | $75,409 |
| Mean | $33,214 | $49,825 |
| Median | $33,192 | $50,915 |
| Interquartile 25% (IQ1) | $26,374 | $41,288 |
| Interquartile 75% (IQ3) | $38,222 | $60,205 |
| Interquartile Range (IQR) | $11,848 | $18,917 |
| Standard Deviation (Sample) | $9,446 | $16,836 |
| Standard Deviation (Population) | $9,383 | $16,430 |
Similar Demographics by Per Capita Income
Demographics Similar to Spaniards by Per Capita Income
In terms of per capita income, the demographic groups most similar to Spaniards are Immigrants ($43,010, a difference of 0.040%), French Canadian ($43,003, a difference of 0.060%), German ($43,067, a difference of 0.090%), Immigrants from Colombia ($42,971, a difference of 0.13%), and Immigrants from Africa ($42,950, a difference of 0.18%).
| Demographics | Rating | Rank | Per Capita Income |
| Tlingit-Haida | 45.9 /100 | #177 | Average $43,516 |
| Immigrants | Costa Rica | 44.5 /100 | #178 | Average $43,464 |
| Finns | 44.4 /100 | #179 | Average $43,461 |
| Sierra Leoneans | 42.9 /100 | #180 | Average $43,405 |
| Welsh | 38.2 /100 | #181 | Fair $43,233 |
| Immigrants | Vietnam | 38.1 /100 | #182 | Fair $43,229 |
| Germans | 33.9 /100 | #183 | Fair $43,067 |
| Spaniards | 32.9 /100 | #184 | Fair $43,028 |
| Immigrants | Immigrants | 32.5 /100 | #185 | Fair $43,010 |
| French Canadians | 32.3 /100 | #186 | Fair $43,003 |
| Immigrants | Colombia | 31.5 /100 | #187 | Fair $42,971 |
| Immigrants | Africa | 31.0 /100 | #188 | Fair $42,950 |
| Bermudans | 30.1 /100 | #189 | Fair $42,911 |
| Kenyans | 27.7 /100 | #190 | Fair $42,808 |
| Yugoslavians | 27.4 /100 | #191 | Fair $42,792 |
Demographics Similar to Immigrants from Bulgaria by Per Capita Income
In terms of per capita income, the demographic groups most similar to Immigrants from Bulgaria are Immigrants from Romania ($49,463, a difference of 0.040%), Lithuanian ($49,448, a difference of 0.070%), Bolivian ($49,526, a difference of 0.090%), Immigrants from Canada ($49,412, a difference of 0.14%), and Immigrants from Argentina ($49,627, a difference of 0.29%).
| Demographics | Rating | Rank | Per Capita Income |
| Bhutanese | 99.9 /100 | #59 | Exceptional $49,894 |
| Immigrants | Scotland | 99.9 /100 | #60 | Exceptional $49,893 |
| Argentineans | 99.9 /100 | #61 | Exceptional $49,862 |
| Immigrants | Asia | 99.9 /100 | #62 | Exceptional $49,741 |
| Maltese | 99.9 /100 | #63 | Exceptional $49,640 |
| Immigrants | Argentina | 99.9 /100 | #64 | Exceptional $49,627 |
| Bolivians | 99.9 /100 | #65 | Exceptional $49,526 |
| Immigrants | Bulgaria | 99.9 /100 | #66 | Exceptional $49,482 |
| Immigrants | Romania | 99.9 /100 | #67 | Exceptional $49,463 |
| Lithuanians | 99.8 /100 | #68 | Exceptional $49,448 |
| Immigrants | Canada | 99.8 /100 | #69 | Exceptional $49,412 |
| Immigrants | Eastern Europe | 99.8 /100 | #70 | Exceptional $49,316 |
| Greeks | 99.8 /100 | #71 | Exceptional $49,309 |
| Immigrants | Hungary | 99.8 /100 | #72 | Exceptional $49,303 |
| Immigrants | North America | 99.8 /100 | #73 | Exceptional $49,302 |