South African vs Cypriot Ambulatory Disability
COMPARE
South African
Cypriot
Ambulatory Disability
Ambulatory Disability Comparison
South Africans
Cypriots
5.9%
AMBULATORY DISABILITY
96.3/ 100
METRIC RATING
112th/ 347
METRIC RANK
5.5%
AMBULATORY DISABILITY
100.0/ 100
METRIC RATING
38th/ 347
METRIC RANK
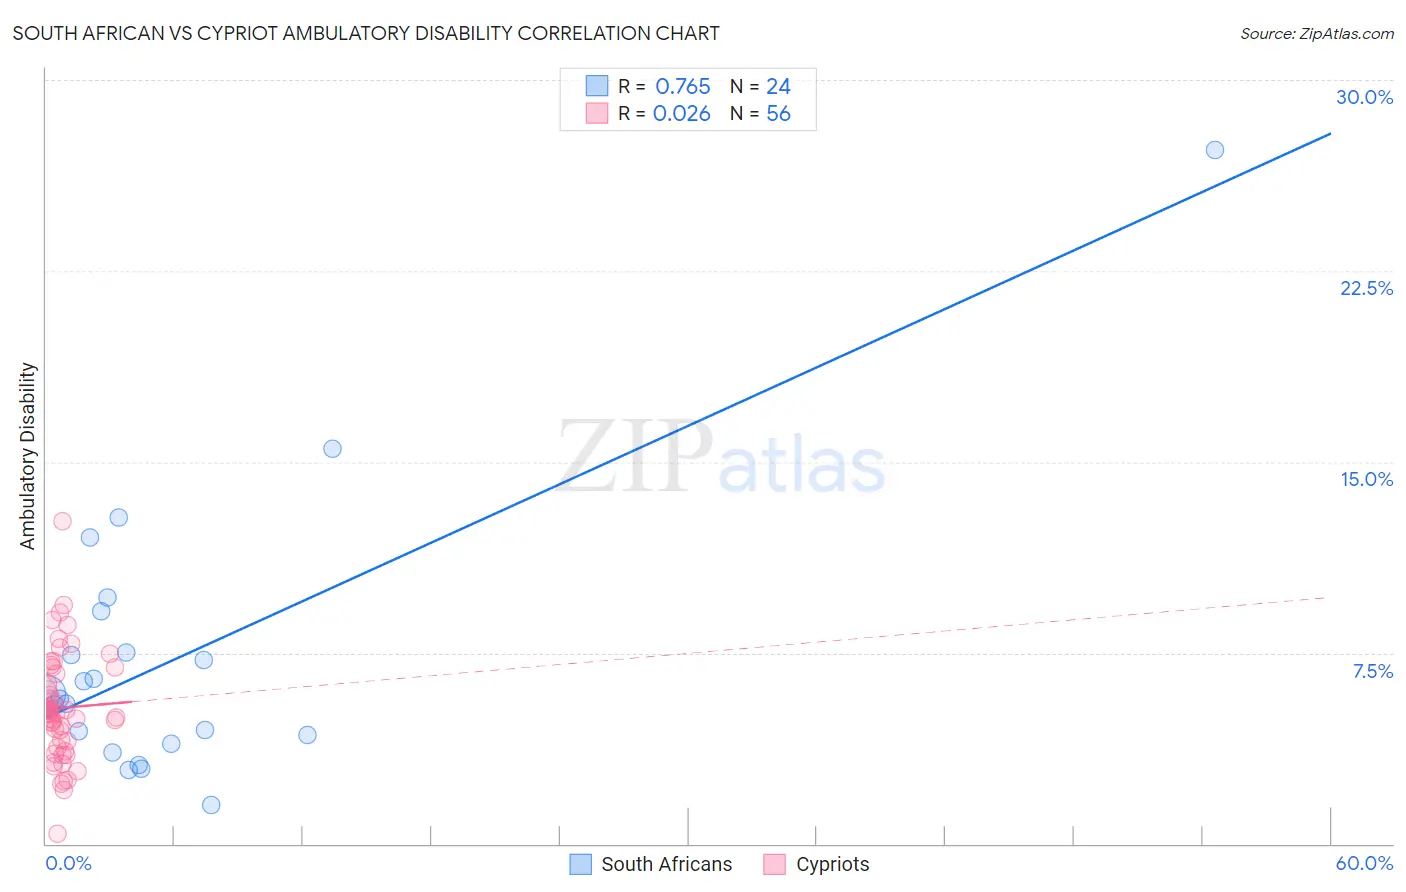
South African vs Cypriot Ambulatory Disability Correlation Chart
The statistical analysis conducted on geographies consisting of 182,561,768 people shows a strong positive correlation between the proportion of South Africans and percentage of population with ambulatory disability in the United States with a correlation coefficient (R) of 0.765 and weighted average of 5.9%. Similarly, the statistical analysis conducted on geographies consisting of 61,870,126 people shows no correlation between the proportion of Cypriots and percentage of population with ambulatory disability in the United States with a correlation coefficient (R) of 0.026 and weighted average of 5.5%, a difference of 6.9%.
Ambulatory Disability Correlation Summary
| Measurement | South African | Cypriot |
| Minimum | 1.5% | 0.38% |
| Maximum | 27.3% | 12.7% |
| Range | 25.7% | 12.3% |
| Mean | 7.3% | 5.3% |
| Median | 5.8% | 5.1% |
| Interquartile 25% (IQ1) | 4.1% | 3.9% |
| Interquartile 75% (IQ3) | 8.3% | 6.8% |
| Interquartile Range (IQR) | 4.2% | 2.9% |
| Standard Deviation (Sample) | 5.4% | 2.1% |
| Standard Deviation (Population) | 5.3% | 2.1% |
Similar Demographics by Ambulatory Disability
Demographics Similar to South Africans by Ambulatory Disability
In terms of ambulatory disability, the demographic groups most similar to South Africans are Danish (5.8%, a difference of 0.13%), Immigrants from Colombia (5.8%, a difference of 0.20%), Immigrants from Uruguay (5.9%, a difference of 0.22%), Immigrants from Poland (5.9%, a difference of 0.28%), and Immigrants from Netherlands (5.8%, a difference of 0.38%).
| Demographics | Rating | Rank | Ambulatory Disability |
| Immigrants | Czechoslovakia | 97.4 /100 | #105 | Exceptional 5.8% |
| Immigrants | Morocco | 97.3 /100 | #106 | Exceptional 5.8% |
| Uruguayans | 97.2 /100 | #107 | Exceptional 5.8% |
| Colombians | 97.2 /100 | #108 | Exceptional 5.8% |
| Immigrants | Netherlands | 97.1 /100 | #109 | Exceptional 5.8% |
| Immigrants | Colombia | 96.7 /100 | #110 | Exceptional 5.8% |
| Danes | 96.6 /100 | #111 | Exceptional 5.8% |
| South Africans | 96.3 /100 | #112 | Exceptional 5.9% |
| Immigrants | Uruguay | 95.6 /100 | #113 | Exceptional 5.9% |
| Immigrants | Poland | 95.4 /100 | #114 | Exceptional 5.9% |
| South American Indians | 94.8 /100 | #115 | Exceptional 5.9% |
| Immigrants | Africa | 94.7 /100 | #116 | Exceptional 5.9% |
| Immigrants | South Eastern Asia | 93.6 /100 | #117 | Exceptional 5.9% |
| Russians | 93.4 /100 | #118 | Exceptional 5.9% |
| Norwegians | 93.1 /100 | #119 | Exceptional 5.9% |
Demographics Similar to Cypriots by Ambulatory Disability
In terms of ambulatory disability, the demographic groups most similar to Cypriots are Turkish (5.5%, a difference of 0.010%), Immigrants from Malaysia (5.5%, a difference of 0.020%), Afghan (5.5%, a difference of 0.090%), Immigrants from Eritrea (5.5%, a difference of 0.090%), and Immigrants from Asia (5.5%, a difference of 0.13%).
| Demographics | Rating | Rank | Ambulatory Disability |
| Immigrants | Venezuela | 100.0 /100 | #31 | Exceptional 5.4% |
| Immigrants | Australia | 100.0 /100 | #32 | Exceptional 5.5% |
| Immigrants | Pakistan | 100.0 /100 | #33 | Exceptional 5.5% |
| Immigrants | Asia | 100.0 /100 | #34 | Exceptional 5.5% |
| Afghans | 100.0 /100 | #35 | Exceptional 5.5% |
| Immigrants | Malaysia | 100.0 /100 | #36 | Exceptional 5.5% |
| Turks | 100.0 /100 | #37 | Exceptional 5.5% |
| Cypriots | 100.0 /100 | #38 | Exceptional 5.5% |
| Immigrants | Eritrea | 100.0 /100 | #39 | Exceptional 5.5% |
| Venezuelans | 99.9 /100 | #40 | Exceptional 5.5% |
| Mongolians | 99.9 /100 | #41 | Exceptional 5.5% |
| Argentineans | 99.9 /100 | #42 | Exceptional 5.5% |
| Paraguayans | 99.9 /100 | #43 | Exceptional 5.5% |
| Immigrants | Indonesia | 99.9 /100 | #44 | Exceptional 5.5% |
| Immigrants | Sweden | 99.9 /100 | #45 | Exceptional 5.6% |