South African vs Laotian Median Female Earnings
COMPARE
South African
Laotian
Median Female Earnings
Median Female Earnings Comparison
South Africans
Laotians
$41,825
MEDIAN FEMALE EARNINGS
98.8/ 100
METRIC RATING
96th/ 347
METRIC RANK
$42,133
MEDIAN FEMALE EARNINGS
99.4/ 100
METRIC RATING
85th/ 347
METRIC RANK
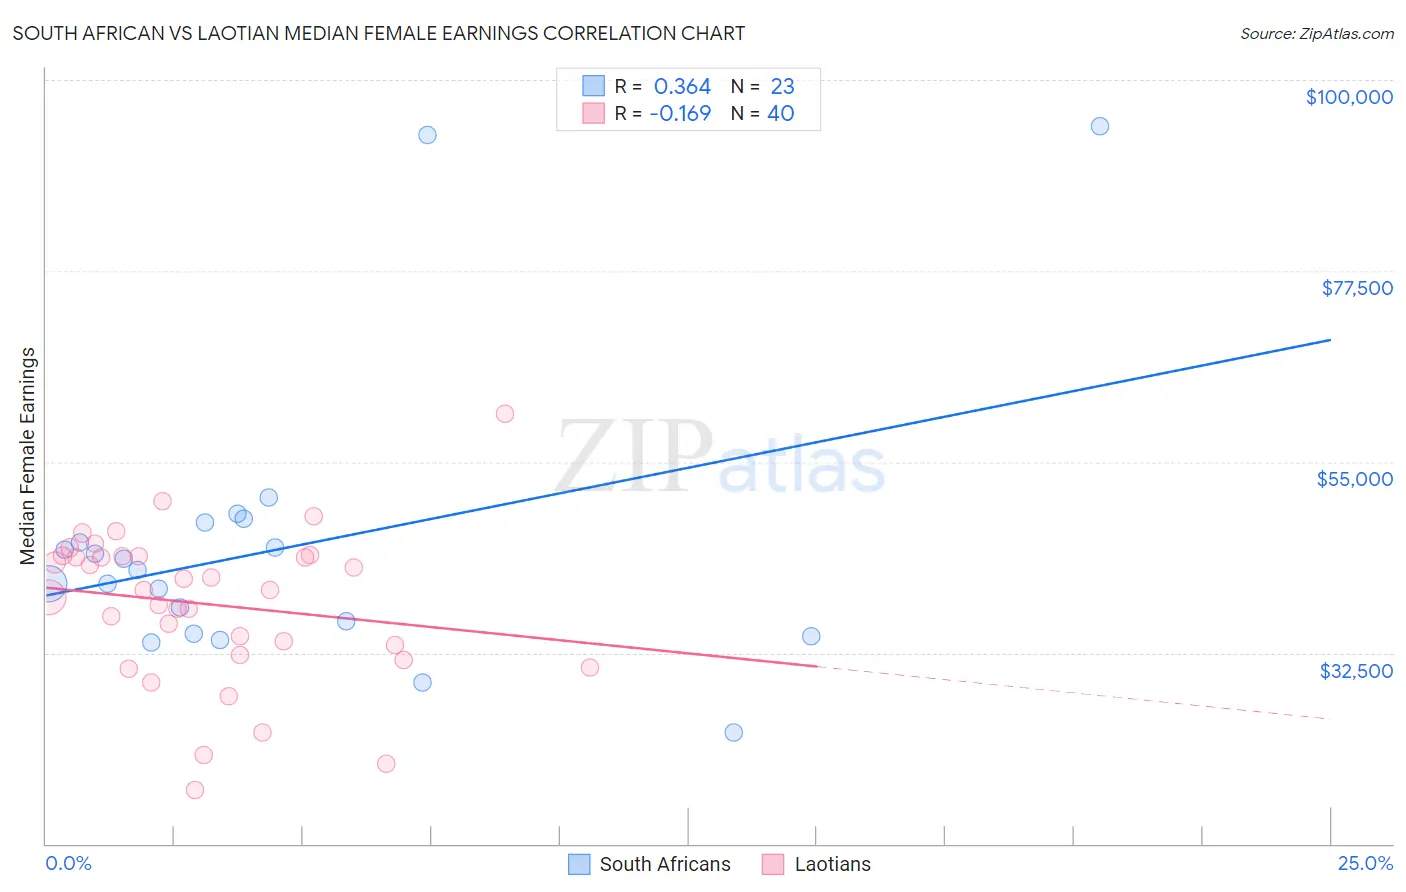
South African vs Laotian Median Female Earnings Correlation Chart
The statistical analysis conducted on geographies consisting of 182,555,636 people shows a mild positive correlation between the proportion of South Africans and median female earnings in the United States with a correlation coefficient (R) of 0.364 and weighted average of $41,825. Similarly, the statistical analysis conducted on geographies consisting of 224,815,855 people shows a poor negative correlation between the proportion of Laotians and median female earnings in the United States with a correlation coefficient (R) of -0.169 and weighted average of $42,133, a difference of 0.74%.
Median Female Earnings Correlation Summary
| Measurement | South African | Laotian |
| Minimum | $23,068 | $16,291 |
| Maximum | $94,510 | $60,722 |
| Range | $71,442 | $44,431 |
| Mean | $44,927 | $38,224 |
| Median | $42,310 | $39,876 |
| Interquartile 25% (IQ1) | $34,713 | $32,877 |
| Interquartile 75% (IQ3) | $47,886 | $43,879 |
| Interquartile Range (IQR) | $13,173 | $11,002 |
| Standard Deviation (Sample) | $16,884 | $8,986 |
| Standard Deviation (Population) | $16,513 | $8,873 |
Demographics Similar to South Africans and Laotians by Median Female Earnings
In terms of median female earnings, the demographic groups most similar to South Africans are Immigrants from Hungary ($41,820, a difference of 0.010%), Moroccan ($41,872, a difference of 0.11%), Immigrants from Netherlands ($41,870, a difference of 0.11%), Immigrants from Scotland ($41,771, a difference of 0.13%), and Immigrants from Grenada ($41,932, a difference of 0.26%). Similarly, the demographic groups most similar to Laotians are Immigrants from St. Vincent and the Grenadines ($42,108, a difference of 0.060%), Lithuanian ($42,108, a difference of 0.060%), Immigrants from Northern Africa ($42,084, a difference of 0.12%), Immigrants from Afghanistan ($42,055, a difference of 0.18%), and Immigrants from Sierra Leone ($42,214, a difference of 0.19%).
| Demographics | Rating | Rank | Median Female Earnings |
| Immigrants | Moldova | 99.6 /100 | #80 | Exceptional $42,304 |
| Immigrants | Southern Europe | 99.5 /100 | #81 | Exceptional $42,275 |
| Immigrants | Morocco | 99.5 /100 | #82 | Exceptional $42,229 |
| Immigrants | Sierra Leone | 99.5 /100 | #83 | Exceptional $42,214 |
| Armenians | 99.5 /100 | #84 | Exceptional $42,212 |
| Laotians | 99.4 /100 | #85 | Exceptional $42,133 |
| Immigrants | St. Vincent and the Grenadines | 99.3 /100 | #86 | Exceptional $42,108 |
| Lithuanians | 99.3 /100 | #87 | Exceptional $42,108 |
| Immigrants | Northern Africa | 99.3 /100 | #88 | Exceptional $42,084 |
| Immigrants | Afghanistan | 99.3 /100 | #89 | Exceptional $42,055 |
| Ukrainians | 99.2 /100 | #90 | Exceptional $42,015 |
| Immigrants | Western Europe | 99.2 /100 | #91 | Exceptional $41,990 |
| Argentineans | 99.1 /100 | #92 | Exceptional $41,952 |
| Immigrants | Grenada | 99.0 /100 | #93 | Exceptional $41,932 |
| Moroccans | 98.9 /100 | #94 | Exceptional $41,872 |
| Immigrants | Netherlands | 98.9 /100 | #95 | Exceptional $41,870 |
| South Africans | 98.8 /100 | #96 | Exceptional $41,825 |
| Immigrants | Hungary | 98.8 /100 | #97 | Exceptional $41,820 |
| Immigrants | Scotland | 98.7 /100 | #98 | Exceptional $41,771 |
| Immigrants | Barbados | 98.4 /100 | #99 | Exceptional $41,685 |
| Romanians | 98.3 /100 | #100 | Exceptional $41,663 |