Slovene vs Chinese Median Earnings
COMPARE
Slovene
Chinese
Median Earnings
Median Earnings Comparison
Slovenes
Chinese
$47,995
MEDIAN EARNINGS
90.0/ 100
METRIC RATING
136th/ 347
METRIC RANK
$48,836
MEDIAN EARNINGS
96.7/ 100
METRIC RATING
115th/ 347
METRIC RANK
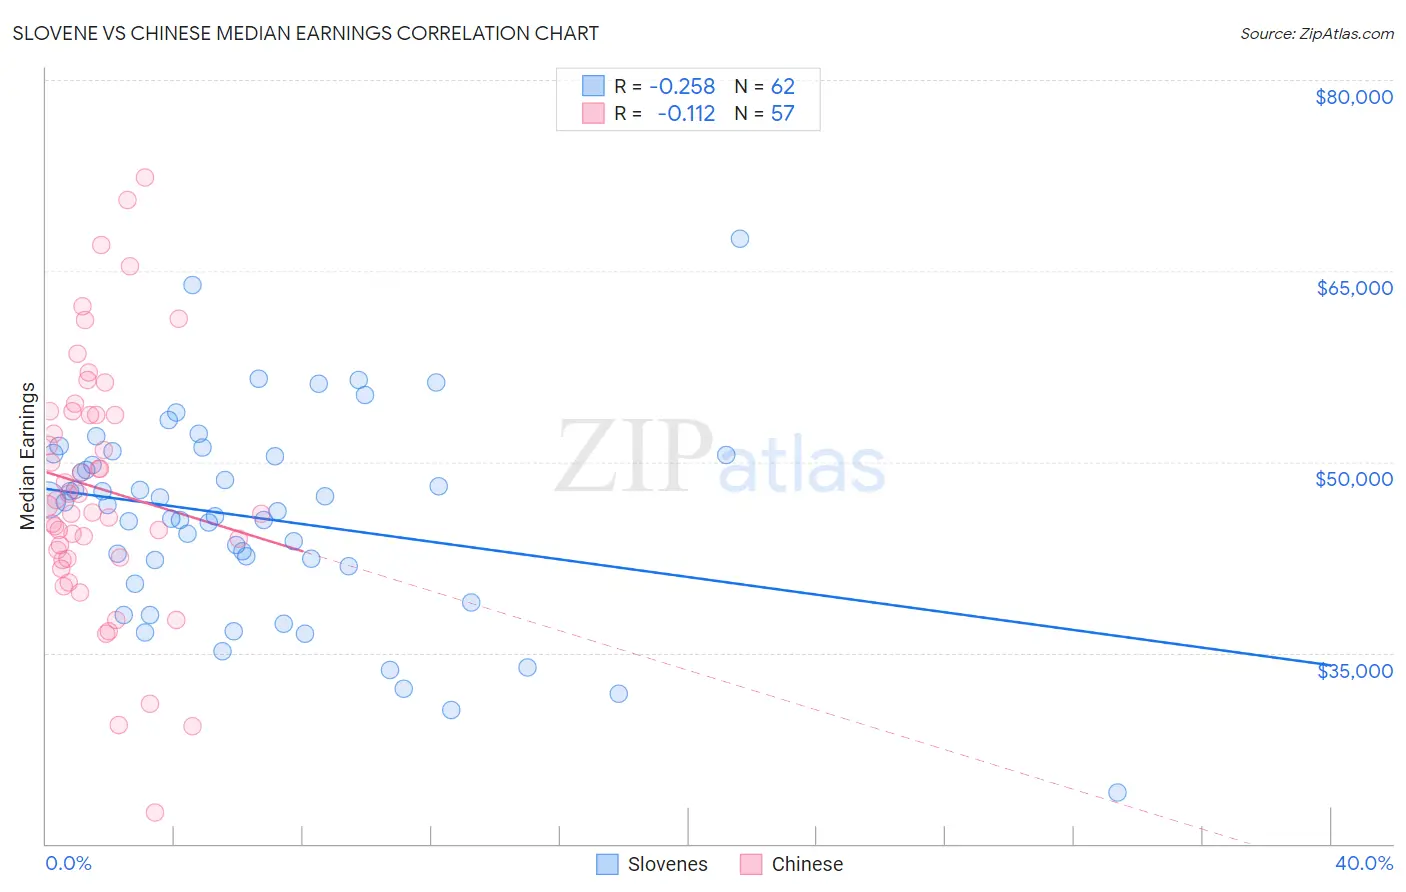
Slovene vs Chinese Median Earnings Correlation Chart
The statistical analysis conducted on geographies consisting of 261,342,703 people shows a weak negative correlation between the proportion of Slovenes and median earnings in the United States with a correlation coefficient (R) of -0.258 and weighted average of $47,995. Similarly, the statistical analysis conducted on geographies consisting of 64,808,012 people shows a poor negative correlation between the proportion of Chinese and median earnings in the United States with a correlation coefficient (R) of -0.112 and weighted average of $48,836, a difference of 1.8%.
Median Earnings Correlation Summary
| Measurement | Slovene | Chinese |
| Minimum | $24,000 | $22,468 |
| Maximum | $67,559 | $72,308 |
| Range | $43,559 | $49,840 |
| Mean | $45,611 | $47,945 |
| Median | $46,389 | $46,556 |
| Interquartile 25% (IQ1) | $41,769 | $42,425 |
| Interquartile 75% (IQ3) | $50,577 | $53,869 |
| Interquartile Range (IQR) | $8,808 | $11,444 |
| Standard Deviation (Sample) | $7,962 | $9,906 |
| Standard Deviation (Population) | $7,897 | $9,819 |
Similar Demographics by Median Earnings
Demographics Similar to Slovenes by Median Earnings
In terms of median earnings, the demographic groups most similar to Slovenes are Portuguese ($48,032, a difference of 0.080%), Sri Lankan ($48,040, a difference of 0.090%), Immigrants from Uganda ($48,041, a difference of 0.10%), Immigrants from Nepal ($47,925, a difference of 0.15%), and European ($47,915, a difference of 0.17%).
| Demographics | Rating | Rank | Median Earnings |
| Pakistanis | 92.8 /100 | #129 | Exceptional $48,254 |
| Zimbabweans | 92.6 /100 | #130 | Exceptional $48,229 |
| Lebanese | 92.5 /100 | #131 | Exceptional $48,226 |
| British | 92.2 /100 | #132 | Exceptional $48,189 |
| Immigrants | Uganda | 90.5 /100 | #133 | Exceptional $48,041 |
| Sri Lankans | 90.5 /100 | #134 | Exceptional $48,040 |
| Portuguese | 90.4 /100 | #135 | Exceptional $48,032 |
| Slovenes | 90.0 /100 | #136 | Excellent $47,995 |
| Immigrants | Nepal | 89.0 /100 | #137 | Excellent $47,925 |
| Europeans | 88.9 /100 | #138 | Excellent $47,915 |
| Canadians | 88.8 /100 | #139 | Excellent $47,911 |
| Taiwanese | 88.7 /100 | #140 | Excellent $47,902 |
| Immigrants | Sierra Leone | 88.3 /100 | #141 | Excellent $47,875 |
| Ugandans | 88.0 /100 | #142 | Excellent $47,854 |
| Swedes | 88.0 /100 | #143 | Excellent $47,851 |
Demographics Similar to Chinese by Median Earnings
In terms of median earnings, the demographic groups most similar to Chinese are Moroccan ($48,838, a difference of 0.010%), Immigrants from Kuwait ($48,861, a difference of 0.050%), Northern European ($48,887, a difference of 0.10%), Immigrants from Zimbabwe ($48,913, a difference of 0.16%), and Immigrants from Ethiopia ($48,924, a difference of 0.18%).
| Demographics | Rating | Rank | Median Earnings |
| Palestinians | 98.0 /100 | #108 | Exceptional $49,209 |
| Syrians | 97.1 /100 | #109 | Exceptional $48,934 |
| Immigrants | Ethiopia | 97.1 /100 | #110 | Exceptional $48,924 |
| Immigrants | Zimbabwe | 97.0 /100 | #111 | Exceptional $48,913 |
| Northern Europeans | 96.9 /100 | #112 | Exceptional $48,887 |
| Immigrants | Kuwait | 96.8 /100 | #113 | Exceptional $48,861 |
| Moroccans | 96.7 /100 | #114 | Exceptional $48,838 |
| Chinese | 96.7 /100 | #115 | Exceptional $48,836 |
| Koreans | 96.2 /100 | #116 | Exceptional $48,727 |
| Serbians | 95.9 /100 | #117 | Exceptional $48,677 |
| Immigrants | Jordan | 95.9 /100 | #118 | Exceptional $48,673 |
| Poles | 95.8 /100 | #119 | Exceptional $48,659 |
| Carpatho Rusyns | 95.5 /100 | #120 | Exceptional $48,617 |
| Arabs | 95.4 /100 | #121 | Exceptional $48,599 |
| Chileans | 94.8 /100 | #122 | Exceptional $48,504 |