Slovene vs Paiute Median Earnings
COMPARE
Slovene
Paiute
Median Earnings
Median Earnings Comparison
Slovenes
Paiute
$47,995
MEDIAN EARNINGS
90.0/ 100
METRIC RATING
136th/ 347
METRIC RANK
$41,508
MEDIAN EARNINGS
0.1/ 100
METRIC RATING
290th/ 347
METRIC RANK
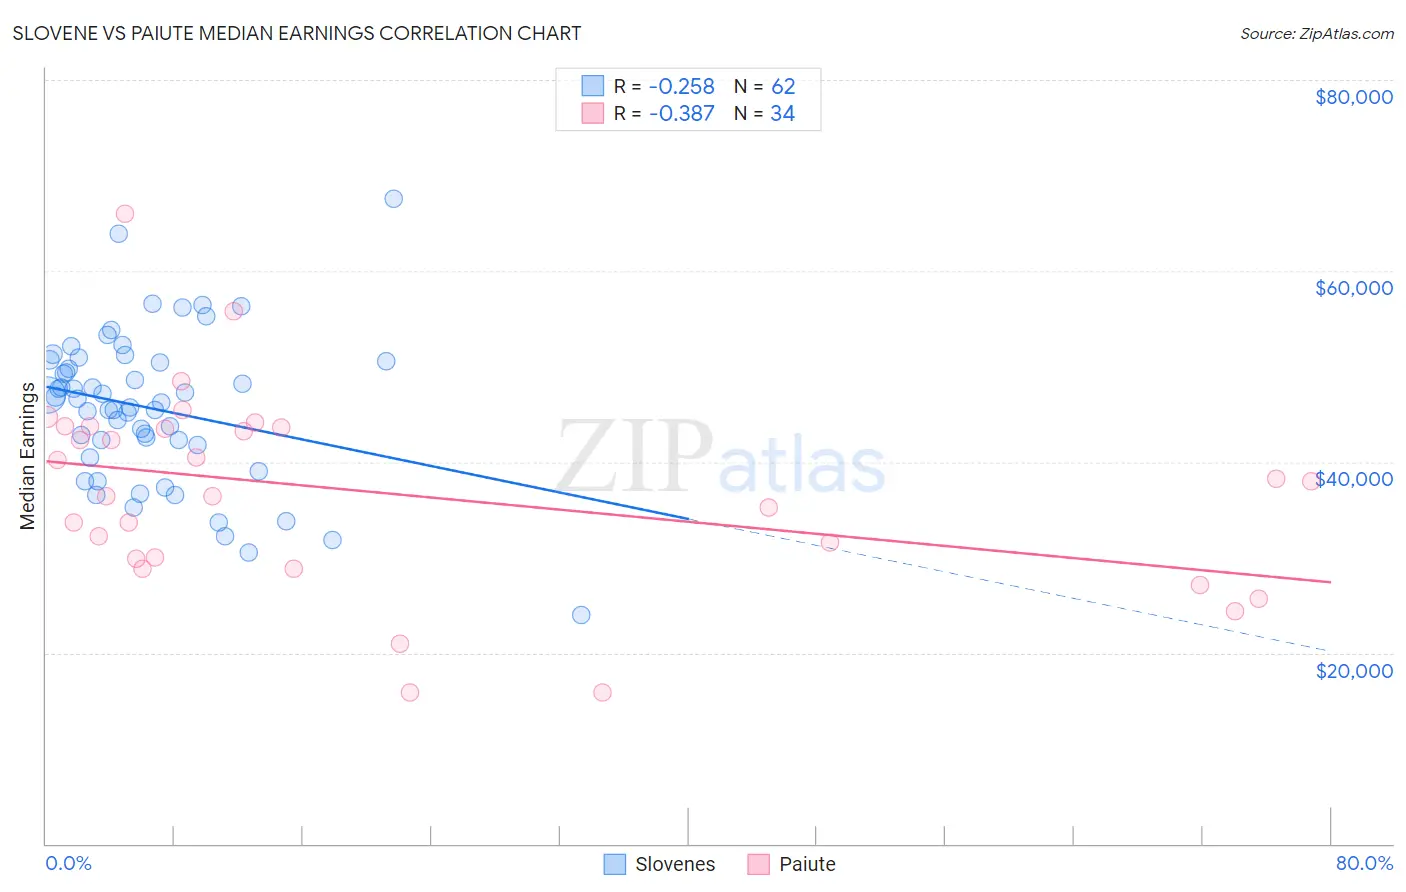
Slovene vs Paiute Median Earnings Correlation Chart
The statistical analysis conducted on geographies consisting of 261,342,703 people shows a weak negative correlation between the proportion of Slovenes and median earnings in the United States with a correlation coefficient (R) of -0.258 and weighted average of $47,995. Similarly, the statistical analysis conducted on geographies consisting of 58,401,249 people shows a mild negative correlation between the proportion of Paiute and median earnings in the United States with a correlation coefficient (R) of -0.387 and weighted average of $41,508, a difference of 15.6%.
Median Earnings Correlation Summary
| Measurement | Slovene | Paiute |
| Minimum | $24,000 | $15,859 |
| Maximum | $67,559 | $65,957 |
| Range | $43,559 | $50,098 |
| Mean | $45,611 | $36,753 |
| Median | $46,389 | $37,218 |
| Interquartile 25% (IQ1) | $41,769 | $29,813 |
| Interquartile 75% (IQ3) | $50,577 | $43,606 |
| Interquartile Range (IQR) | $8,808 | $13,793 |
| Standard Deviation (Sample) | $7,962 | $10,514 |
| Standard Deviation (Population) | $7,897 | $10,358 |
Similar Demographics by Median Earnings
Demographics Similar to Slovenes by Median Earnings
In terms of median earnings, the demographic groups most similar to Slovenes are Portuguese ($48,032, a difference of 0.080%), Sri Lankan ($48,040, a difference of 0.090%), Immigrants from Uganda ($48,041, a difference of 0.10%), Immigrants from Nepal ($47,925, a difference of 0.15%), and European ($47,915, a difference of 0.17%).
| Demographics | Rating | Rank | Median Earnings |
| Pakistanis | 92.8 /100 | #129 | Exceptional $48,254 |
| Zimbabweans | 92.6 /100 | #130 | Exceptional $48,229 |
| Lebanese | 92.5 /100 | #131 | Exceptional $48,226 |
| British | 92.2 /100 | #132 | Exceptional $48,189 |
| Immigrants | Uganda | 90.5 /100 | #133 | Exceptional $48,041 |
| Sri Lankans | 90.5 /100 | #134 | Exceptional $48,040 |
| Portuguese | 90.4 /100 | #135 | Exceptional $48,032 |
| Slovenes | 90.0 /100 | #136 | Excellent $47,995 |
| Immigrants | Nepal | 89.0 /100 | #137 | Excellent $47,925 |
| Europeans | 88.9 /100 | #138 | Excellent $47,915 |
| Canadians | 88.8 /100 | #139 | Excellent $47,911 |
| Taiwanese | 88.7 /100 | #140 | Excellent $47,902 |
| Immigrants | Sierra Leone | 88.3 /100 | #141 | Excellent $47,875 |
| Ugandans | 88.0 /100 | #142 | Excellent $47,854 |
| Swedes | 88.0 /100 | #143 | Excellent $47,851 |
Demographics Similar to Paiute by Median Earnings
In terms of median earnings, the demographic groups most similar to Paiute are Comanche ($41,519, a difference of 0.030%), Central American Indian ($41,474, a difference of 0.080%), Immigrants from Dominican Republic ($41,554, a difference of 0.11%), U.S. Virgin Islander ($41,448, a difference of 0.15%), and Immigrants from Zaire ($41,325, a difference of 0.44%).
| Demographics | Rating | Rank | Median Earnings |
| Dominicans | 0.2 /100 | #283 | Tragic $41,864 |
| Blackfeet | 0.2 /100 | #284 | Tragic $41,822 |
| Immigrants | Nicaragua | 0.1 /100 | #285 | Tragic $41,737 |
| Mexican American Indians | 0.1 /100 | #286 | Tragic $41,719 |
| Indonesians | 0.1 /100 | #287 | Tragic $41,701 |
| Immigrants | Dominican Republic | 0.1 /100 | #288 | Tragic $41,554 |
| Comanche | 0.1 /100 | #289 | Tragic $41,519 |
| Paiute | 0.1 /100 | #290 | Tragic $41,508 |
| Central American Indians | 0.1 /100 | #291 | Tragic $41,474 |
| U.S. Virgin Islanders | 0.1 /100 | #292 | Tragic $41,448 |
| Immigrants | Zaire | 0.1 /100 | #293 | Tragic $41,325 |
| Potawatomi | 0.1 /100 | #294 | Tragic $41,288 |
| Bangladeshis | 0.1 /100 | #295 | Tragic $41,263 |
| Cherokee | 0.1 /100 | #296 | Tragic $41,252 |
| Guatemalans | 0.1 /100 | #297 | Tragic $41,205 |