Slovene vs Immigrants from Northern Africa Median Earnings
COMPARE
Slovene
Immigrants from Northern Africa
Median Earnings
Median Earnings Comparison
Slovenes
Immigrants from Northern Africa
$47,995
MEDIAN EARNINGS
90.0/ 100
METRIC RATING
136th/ 347
METRIC RANK
$49,648
MEDIAN EARNINGS
98.9/ 100
METRIC RATING
98th/ 347
METRIC RANK
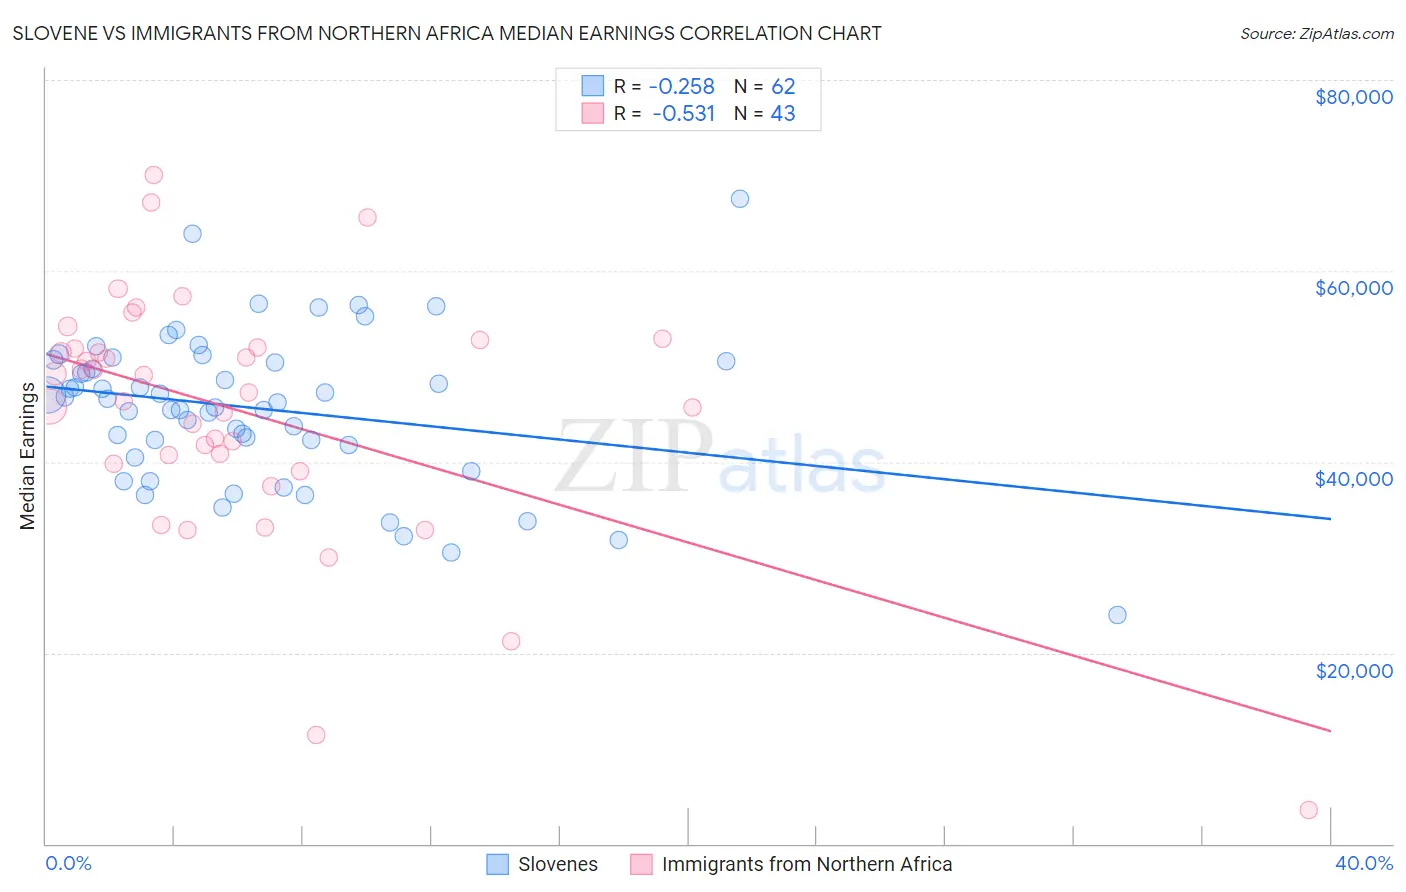
Slovene vs Immigrants from Northern Africa Median Earnings Correlation Chart
The statistical analysis conducted on geographies consisting of 261,342,703 people shows a weak negative correlation between the proportion of Slovenes and median earnings in the United States with a correlation coefficient (R) of -0.258 and weighted average of $47,995. Similarly, the statistical analysis conducted on geographies consisting of 321,196,666 people shows a substantial negative correlation between the proportion of Immigrants from Northern Africa and median earnings in the United States with a correlation coefficient (R) of -0.531 and weighted average of $49,648, a difference of 3.4%.
Median Earnings Correlation Summary
| Measurement | Slovene | Immigrants from Northern Africa |
| Minimum | $24,000 | $3,500 |
| Maximum | $67,559 | $70,043 |
| Range | $43,559 | $66,543 |
| Mean | $45,611 | $45,203 |
| Median | $46,389 | $47,214 |
| Interquartile 25% (IQ1) | $41,769 | $39,837 |
| Interquartile 75% (IQ3) | $50,577 | $52,025 |
| Interquartile Range (IQR) | $8,808 | $12,188 |
| Standard Deviation (Sample) | $7,962 | $12,971 |
| Standard Deviation (Population) | $7,897 | $12,819 |
Similar Demographics by Median Earnings
Demographics Similar to Slovenes by Median Earnings
In terms of median earnings, the demographic groups most similar to Slovenes are Portuguese ($48,032, a difference of 0.080%), Sri Lankan ($48,040, a difference of 0.090%), Immigrants from Uganda ($48,041, a difference of 0.10%), Immigrants from Nepal ($47,925, a difference of 0.15%), and European ($47,915, a difference of 0.17%).
| Demographics | Rating | Rank | Median Earnings |
| Pakistanis | 92.8 /100 | #129 | Exceptional $48,254 |
| Zimbabweans | 92.6 /100 | #130 | Exceptional $48,229 |
| Lebanese | 92.5 /100 | #131 | Exceptional $48,226 |
| British | 92.2 /100 | #132 | Exceptional $48,189 |
| Immigrants | Uganda | 90.5 /100 | #133 | Exceptional $48,041 |
| Sri Lankans | 90.5 /100 | #134 | Exceptional $48,040 |
| Portuguese | 90.4 /100 | #135 | Exceptional $48,032 |
| Slovenes | 90.0 /100 | #136 | Excellent $47,995 |
| Immigrants | Nepal | 89.0 /100 | #137 | Excellent $47,925 |
| Europeans | 88.9 /100 | #138 | Excellent $47,915 |
| Canadians | 88.8 /100 | #139 | Excellent $47,911 |
| Taiwanese | 88.7 /100 | #140 | Excellent $47,902 |
| Immigrants | Sierra Leone | 88.3 /100 | #141 | Excellent $47,875 |
| Ugandans | 88.0 /100 | #142 | Excellent $47,854 |
| Swedes | 88.0 /100 | #143 | Excellent $47,851 |
Demographics Similar to Immigrants from Northern Africa by Median Earnings
In terms of median earnings, the demographic groups most similar to Immigrants from Northern Africa are Immigrants from Afghanistan ($49,645, a difference of 0.010%), Immigrants from North Macedonia ($49,658, a difference of 0.020%), Immigrants from Poland ($49,633, a difference of 0.030%), Jordanian ($49,632, a difference of 0.030%), and Immigrants from Lebanon ($49,682, a difference of 0.070%).
| Demographics | Rating | Rank | Median Earnings |
| Macedonians | 99.2 /100 | #91 | Exceptional $49,893 |
| Immigrants | Argentina | 99.2 /100 | #92 | Exceptional $49,841 |
| Armenians | 99.1 /100 | #93 | Exceptional $49,804 |
| Croatians | 99.0 /100 | #94 | Exceptional $49,724 |
| Immigrants | England | 99.0 /100 | #95 | Exceptional $49,722 |
| Immigrants | Lebanon | 99.0 /100 | #96 | Exceptional $49,682 |
| Immigrants | North Macedonia | 98.9 /100 | #97 | Exceptional $49,658 |
| Immigrants | Northern Africa | 98.9 /100 | #98 | Exceptional $49,648 |
| Immigrants | Afghanistan | 98.9 /100 | #99 | Exceptional $49,645 |
| Immigrants | Poland | 98.9 /100 | #100 | Exceptional $49,633 |
| Jordanians | 98.9 /100 | #101 | Exceptional $49,632 |
| Ethiopians | 98.8 /100 | #102 | Exceptional $49,572 |
| Austrians | 98.7 /100 | #103 | Exceptional $49,501 |
| Immigrants | Brazil | 98.6 /100 | #104 | Exceptional $49,463 |
| Immigrants | Western Asia | 98.4 /100 | #105 | Exceptional $49,389 |