Yugoslavian vs Icelander Median Female Earnings
COMPARE
Yugoslavian
Icelander
Median Female Earnings
Median Female Earnings Comparison
Yugoslavians
Icelanders
$38,573
MEDIAN FEMALE EARNINGS
8.8/ 100
METRIC RATING
220th/ 347
METRIC RANK
$39,109
MEDIAN FEMALE EARNINGS
22.7/ 100
METRIC RATING
199th/ 347
METRIC RANK
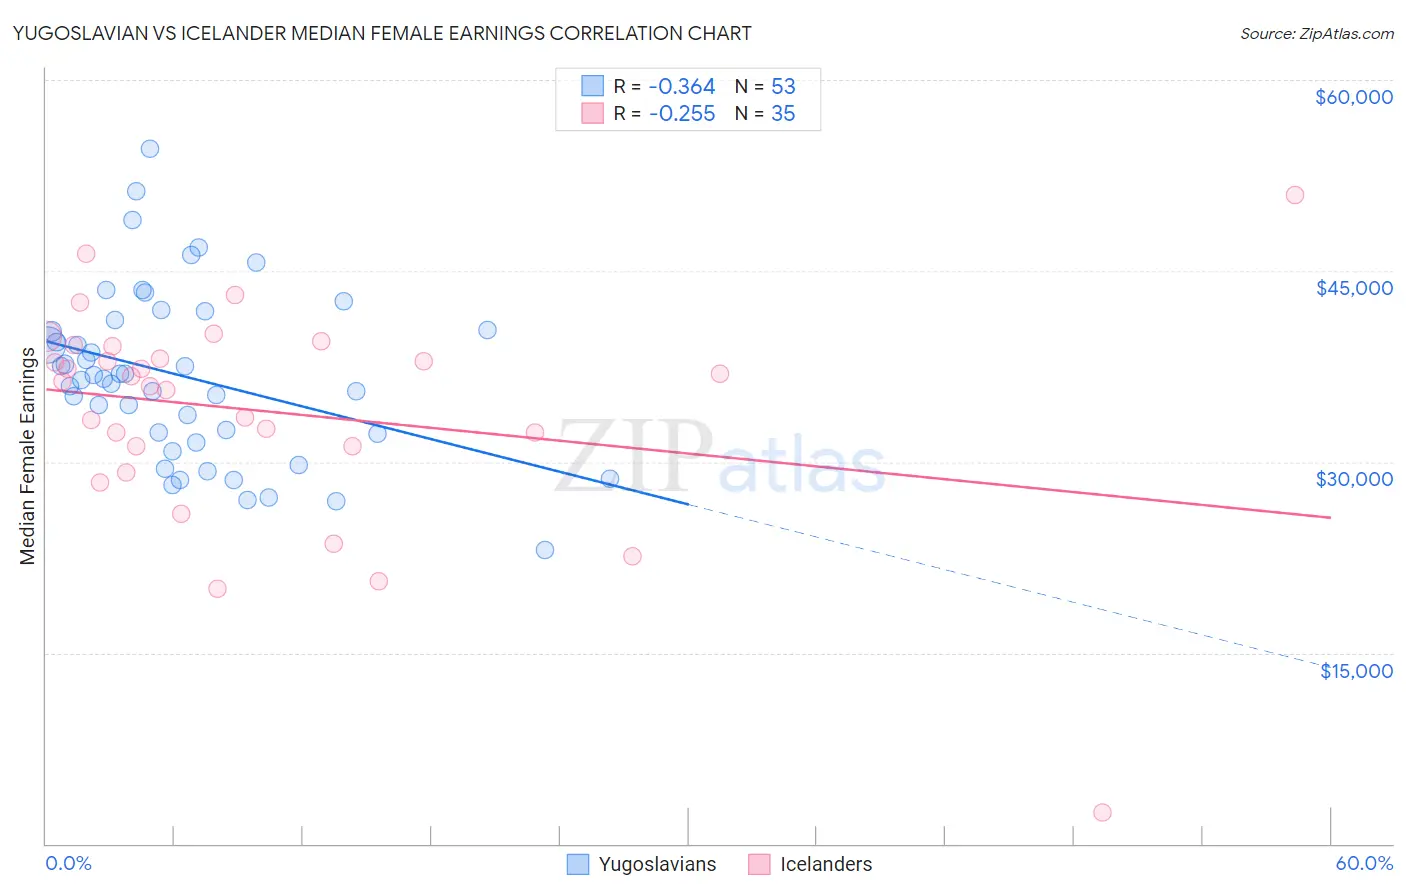
Yugoslavian vs Icelander Median Female Earnings Correlation Chart
The statistical analysis conducted on geographies consisting of 285,638,776 people shows a mild negative correlation between the proportion of Yugoslavians and median female earnings in the United States with a correlation coefficient (R) of -0.364 and weighted average of $38,573. Similarly, the statistical analysis conducted on geographies consisting of 159,641,354 people shows a weak negative correlation between the proportion of Icelanders and median female earnings in the United States with a correlation coefficient (R) of -0.255 and weighted average of $39,109, a difference of 1.4%.
Median Female Earnings Correlation Summary
| Measurement | Yugoslavian | Icelander |
| Minimum | $23,125 | $2,499 |
| Maximum | $54,556 | $50,938 |
| Range | $31,431 | $48,439 |
| Mean | $36,696 | $33,934 |
| Median | $36,579 | $36,326 |
| Interquartile 25% (IQ1) | $31,882 | $31,250 |
| Interquartile 75% (IQ3) | $40,715 | $39,051 |
| Interquartile Range (IQR) | $8,834 | $7,801 |
| Standard Deviation (Sample) | $6,632 | $8,758 |
| Standard Deviation (Population) | $6,570 | $8,632 |
Similar Demographics by Median Female Earnings
Demographics Similar to Yugoslavians by Median Female Earnings
In terms of median female earnings, the demographic groups most similar to Yugoslavians are Immigrants from the Azores ($38,573, a difference of 0.0%), Nepalese ($38,603, a difference of 0.080%), Cape Verdean ($38,614, a difference of 0.11%), Japanese ($38,528, a difference of 0.12%), and Immigrants from Jamaica ($38,625, a difference of 0.14%).
| Demographics | Rating | Rank | Median Female Earnings |
| Jamaicans | 10.5 /100 | #213 | Poor $38,670 |
| Iraqis | 10.5 /100 | #214 | Poor $38,666 |
| Spaniards | 10.3 /100 | #215 | Poor $38,656 |
| Immigrants | Ecuador | 10.1 /100 | #216 | Poor $38,644 |
| Immigrants | Jamaica | 9.7 /100 | #217 | Tragic $38,625 |
| Cape Verdeans | 9.5 /100 | #218 | Tragic $38,614 |
| Nepalese | 9.3 /100 | #219 | Tragic $38,603 |
| Yugoslavians | 8.8 /100 | #220 | Tragic $38,573 |
| Immigrants | Azores | 8.8 /100 | #221 | Tragic $38,573 |
| Japanese | 8.1 /100 | #222 | Tragic $38,528 |
| Immigrants | Sudan | 7.8 /100 | #223 | Tragic $38,511 |
| Native Hawaiians | 7.1 /100 | #224 | Tragic $38,461 |
| French | 7.0 /100 | #225 | Tragic $38,457 |
| French Canadians | 6.8 /100 | #226 | Tragic $38,436 |
| Scottish | 6.3 /100 | #227 | Tragic $38,397 |
Demographics Similar to Icelanders by Median Female Earnings
In terms of median female earnings, the demographic groups most similar to Icelanders are Ecuadorian ($39,117, a difference of 0.020%), Assyrian/Chaldean/Syriac ($39,159, a difference of 0.13%), Immigrants from Panama ($39,049, a difference of 0.15%), Panamanian ($39,049, a difference of 0.15%), and Immigrants from Costa Rica ($39,186, a difference of 0.20%).
| Demographics | Rating | Rank | Median Female Earnings |
| Immigrants | Immigrants | 31.7 /100 | #192 | Fair $39,328 |
| Immigrants | Nigeria | 30.2 /100 | #193 | Fair $39,294 |
| Irish | 30.0 /100 | #194 | Fair $39,291 |
| Uruguayans | 27.3 /100 | #195 | Fair $39,228 |
| Immigrants | Costa Rica | 25.6 /100 | #196 | Fair $39,186 |
| Assyrians/Chaldeans/Syriacs | 24.6 /100 | #197 | Fair $39,159 |
| Ecuadorians | 23.0 /100 | #198 | Fair $39,117 |
| Icelanders | 22.7 /100 | #199 | Fair $39,109 |
| Immigrants | Panama | 20.6 /100 | #200 | Fair $39,049 |
| Panamanians | 20.6 /100 | #201 | Fair $39,049 |
| Slovaks | 19.9 /100 | #202 | Poor $39,029 |
| Czechs | 18.7 /100 | #203 | Poor $38,992 |
| Immigrants | Uruguay | 17.3 /100 | #204 | Poor $38,945 |
| Immigrants | Colombia | 16.3 /100 | #205 | Poor $38,913 |
| Immigrants | Bosnia and Herzegovina | 15.6 /100 | #206 | Poor $38,886 |