Sierra Leonean vs British West Indian Median Male Earnings
COMPARE
Sierra Leonean
British West Indian
Median Male Earnings
Median Male Earnings Comparison
Sierra Leoneans
British West Indians
$54,279
MEDIAN MALE EARNINGS
44.8/ 100
METRIC RATING
178th/ 347
METRIC RANK
$49,636
MEDIAN MALE EARNINGS
0.8/ 100
METRIC RATING
257th/ 347
METRIC RANK
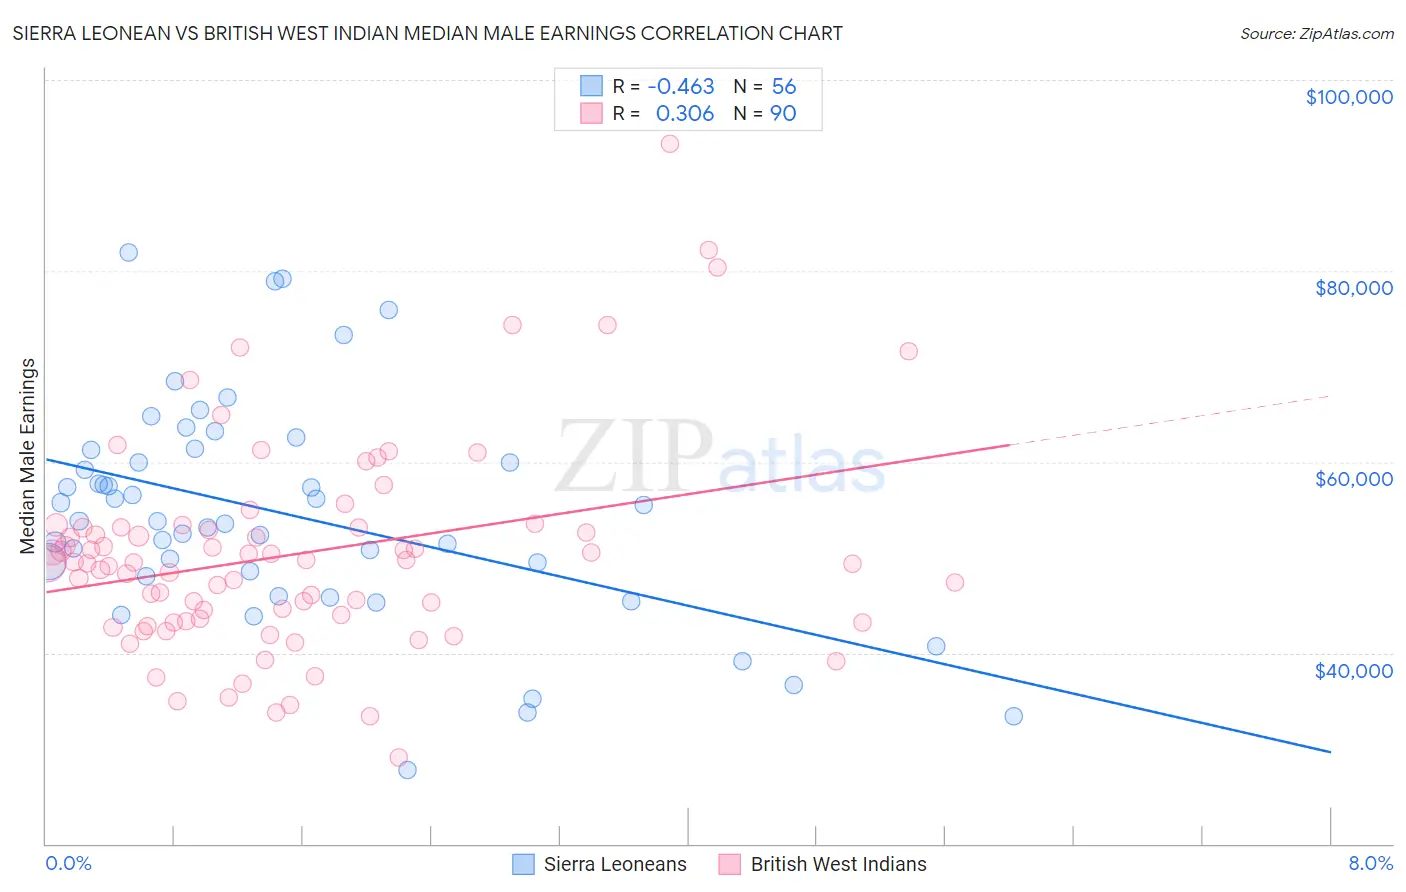
Sierra Leonean vs British West Indian Median Male Earnings Correlation Chart
The statistical analysis conducted on geographies consisting of 83,343,819 people shows a moderate negative correlation between the proportion of Sierra Leoneans and median male earnings in the United States with a correlation coefficient (R) of -0.463 and weighted average of $54,279. Similarly, the statistical analysis conducted on geographies consisting of 152,683,188 people shows a mild positive correlation between the proportion of British West Indians and median male earnings in the United States with a correlation coefficient (R) of 0.306 and weighted average of $49,636, a difference of 9.3%.
Median Male Earnings Correlation Summary
| Measurement | Sierra Leonean | British West Indian |
| Minimum | $27,751 | $28,979 |
| Maximum | $81,874 | $93,333 |
| Range | $54,123 | $64,354 |
| Mean | $54,478 | $50,358 |
| Median | $53,788 | $49,413 |
| Interquartile 25% (IQ1) | $48,321 | $43,337 |
| Interquartile 75% (IQ3) | $60,630 | $53,079 |
| Interquartile Range (IQR) | $12,308 | $9,742 |
| Standard Deviation (Sample) | $11,493 | $11,060 |
| Standard Deviation (Population) | $11,390 | $10,999 |
Similar Demographics by Median Male Earnings
Demographics Similar to Sierra Leoneans by Median Male Earnings
In terms of median male earnings, the demographic groups most similar to Sierra Leoneans are Costa Rican ($54,279, a difference of 0.0%), Celtic ($54,242, a difference of 0.070%), Iraqi ($54,182, a difference of 0.18%), Immigrants ($54,168, a difference of 0.21%), and Spaniard ($54,401, a difference of 0.22%).
| Demographics | Rating | Rank | Median Male Earnings |
| Immigrants | Peru | 54.9 /100 | #171 | Average $54,695 |
| Welsh | 53.8 /100 | #172 | Average $54,647 |
| South American Indians | 50.4 /100 | #173 | Average $54,508 |
| South Americans | 50.0 /100 | #174 | Average $54,492 |
| Dutch | 48.0 /100 | #175 | Average $54,410 |
| Spaniards | 47.8 /100 | #176 | Average $54,401 |
| Costa Ricans | 44.8 /100 | #177 | Average $54,279 |
| Sierra Leoneans | 44.8 /100 | #178 | Average $54,279 |
| Celtics | 43.9 /100 | #179 | Average $54,242 |
| Iraqis | 42.5 /100 | #180 | Average $54,182 |
| Immigrants | Immigrants | 42.1 /100 | #181 | Average $54,168 |
| Yugoslavians | 37.4 /100 | #182 | Fair $53,967 |
| Immigrants | South America | 37.3 /100 | #183 | Fair $53,962 |
| Whites/Caucasians | 36.5 /100 | #184 | Fair $53,925 |
| Immigrants | Sierra Leone | 36.0 /100 | #185 | Fair $53,905 |
Demographics Similar to British West Indians by Median Male Earnings
In terms of median male earnings, the demographic groups most similar to British West Indians are Alaska Native ($49,711, a difference of 0.15%), Alaskan Athabascan ($49,748, a difference of 0.23%), Senegalese ($49,774, a difference of 0.28%), Cree ($49,497, a difference of 0.28%), and Nepalese ($49,458, a difference of 0.36%).
| Demographics | Rating | Rank | Median Male Earnings |
| Osage | 1.6 /100 | #250 | Tragic $50,292 |
| Immigrants | Grenada | 1.6 /100 | #251 | Tragic $50,279 |
| Immigrants | Cabo Verde | 1.2 /100 | #252 | Tragic $50,009 |
| German Russians | 1.1 /100 | #253 | Tragic $49,924 |
| Senegalese | 1.0 /100 | #254 | Tragic $49,774 |
| Alaskan Athabascans | 0.9 /100 | #255 | Tragic $49,748 |
| Alaska Natives | 0.9 /100 | #256 | Tragic $49,711 |
| British West Indians | 0.8 /100 | #257 | Tragic $49,636 |
| Cree | 0.7 /100 | #258 | Tragic $49,497 |
| Nepalese | 0.7 /100 | #259 | Tragic $49,458 |
| Iroquois | 0.7 /100 | #260 | Tragic $49,374 |
| Liberians | 0.6 /100 | #261 | Tragic $49,318 |
| Immigrants | West Indies | 0.6 /100 | #262 | Tragic $49,271 |
| Nicaraguans | 0.6 /100 | #263 | Tragic $49,215 |
| Immigrants | Middle Africa | 0.6 /100 | #264 | Tragic $49,201 |