Sierra Leonean vs Immigrants from Ukraine Median Male Earnings
COMPARE
Sierra Leonean
Immigrants from Ukraine
Median Male Earnings
Median Male Earnings Comparison
Sierra Leoneans
Immigrants from Ukraine
$54,279
MEDIAN MALE EARNINGS
44.8/ 100
METRIC RATING
178th/ 347
METRIC RANK
$59,820
MEDIAN MALE EARNINGS
99.5/ 100
METRIC RATING
79th/ 347
METRIC RANK
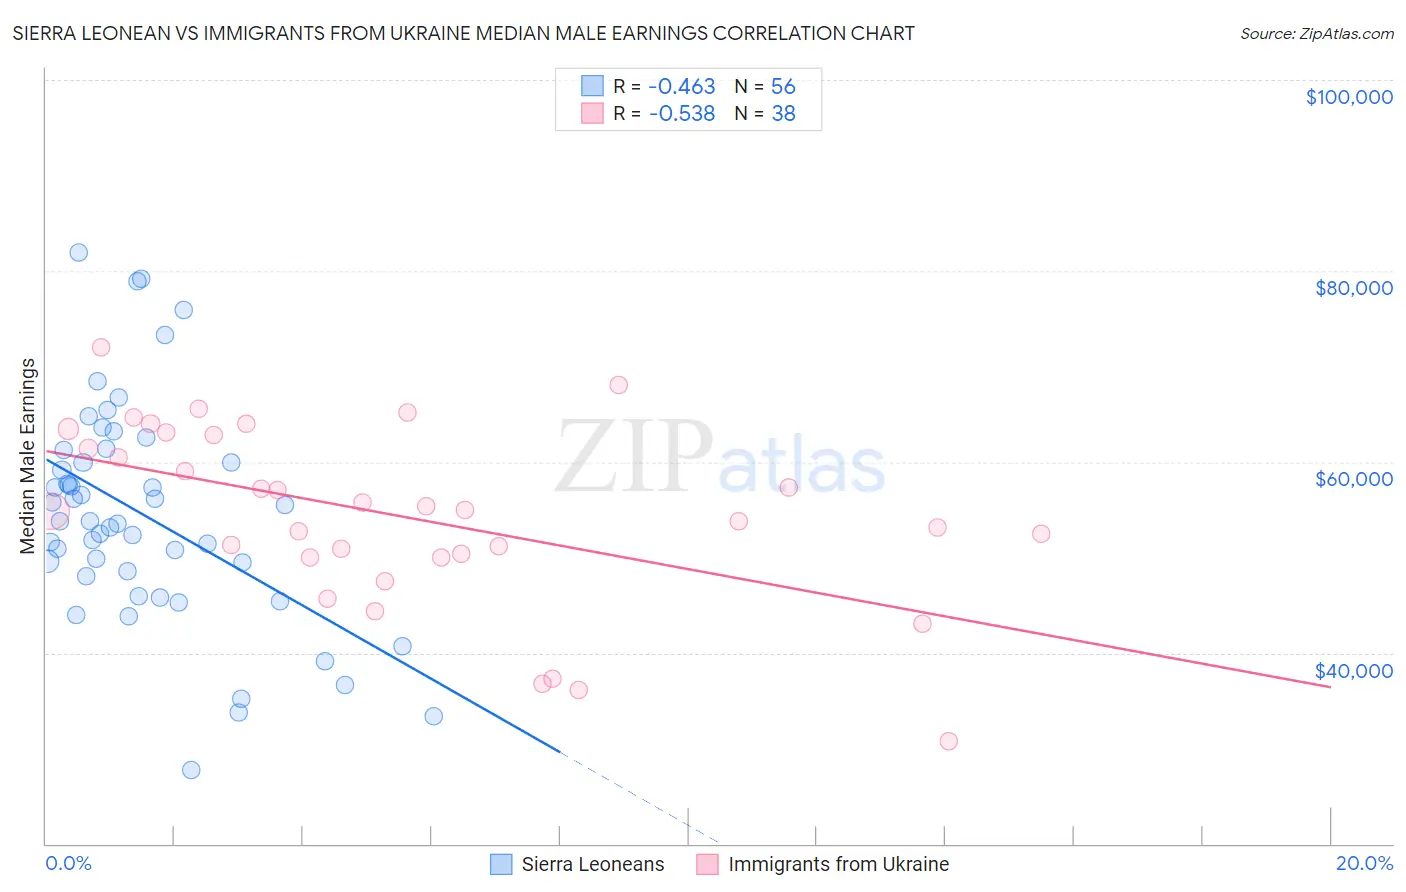
Sierra Leonean vs Immigrants from Ukraine Median Male Earnings Correlation Chart
The statistical analysis conducted on geographies consisting of 83,343,819 people shows a moderate negative correlation between the proportion of Sierra Leoneans and median male earnings in the United States with a correlation coefficient (R) of -0.463 and weighted average of $54,279. Similarly, the statistical analysis conducted on geographies consisting of 289,634,728 people shows a substantial negative correlation between the proportion of Immigrants from Ukraine and median male earnings in the United States with a correlation coefficient (R) of -0.538 and weighted average of $59,820, a difference of 10.2%.
Median Male Earnings Correlation Summary
| Measurement | Sierra Leonean | Immigrants from Ukraine |
| Minimum | $27,751 | $30,721 |
| Maximum | $81,874 | $71,961 |
| Range | $54,123 | $41,240 |
| Mean | $54,478 | $54,290 |
| Median | $53,788 | $54,853 |
| Interquartile 25% (IQ1) | $48,321 | $49,956 |
| Interquartile 75% (IQ3) | $60,630 | $62,824 |
| Interquartile Range (IQR) | $12,308 | $12,868 |
| Standard Deviation (Sample) | $11,493 | $9,509 |
| Standard Deviation (Population) | $11,390 | $9,383 |
Similar Demographics by Median Male Earnings
Demographics Similar to Sierra Leoneans by Median Male Earnings
In terms of median male earnings, the demographic groups most similar to Sierra Leoneans are Costa Rican ($54,279, a difference of 0.0%), Celtic ($54,242, a difference of 0.070%), Iraqi ($54,182, a difference of 0.18%), Immigrants ($54,168, a difference of 0.21%), and Spaniard ($54,401, a difference of 0.22%).
| Demographics | Rating | Rank | Median Male Earnings |
| Immigrants | Peru | 54.9 /100 | #171 | Average $54,695 |
| Welsh | 53.8 /100 | #172 | Average $54,647 |
| South American Indians | 50.4 /100 | #173 | Average $54,508 |
| South Americans | 50.0 /100 | #174 | Average $54,492 |
| Dutch | 48.0 /100 | #175 | Average $54,410 |
| Spaniards | 47.8 /100 | #176 | Average $54,401 |
| Costa Ricans | 44.8 /100 | #177 | Average $54,279 |
| Sierra Leoneans | 44.8 /100 | #178 | Average $54,279 |
| Celtics | 43.9 /100 | #179 | Average $54,242 |
| Iraqis | 42.5 /100 | #180 | Average $54,182 |
| Immigrants | Immigrants | 42.1 /100 | #181 | Average $54,168 |
| Yugoslavians | 37.4 /100 | #182 | Fair $53,967 |
| Immigrants | South America | 37.3 /100 | #183 | Fair $53,962 |
| Whites/Caucasians | 36.5 /100 | #184 | Fair $53,925 |
| Immigrants | Sierra Leone | 36.0 /100 | #185 | Fair $53,905 |
Demographics Similar to Immigrants from Ukraine by Median Male Earnings
In terms of median male earnings, the demographic groups most similar to Immigrants from Ukraine are Immigrants from Hungary ($59,806, a difference of 0.020%), Ukrainian ($59,728, a difference of 0.16%), Immigrants from Egypt ($59,925, a difference of 0.18%), Croatian ($59,715, a difference of 0.18%), and Immigrants from Italy ($59,691, a difference of 0.22%).
| Demographics | Rating | Rank | Median Male Earnings |
| Immigrants | Western Europe | 99.7 /100 | #72 | Exceptional $60,334 |
| Immigrants | North America | 99.7 /100 | #73 | Exceptional $60,265 |
| Argentineans | 99.6 /100 | #74 | Exceptional $60,117 |
| Immigrants | Bolivia | 99.6 /100 | #75 | Exceptional $60,088 |
| Romanians | 99.6 /100 | #76 | Exceptional $60,063 |
| Paraguayans | 99.5 /100 | #77 | Exceptional $59,975 |
| Immigrants | Egypt | 99.5 /100 | #78 | Exceptional $59,925 |
| Immigrants | Ukraine | 99.5 /100 | #79 | Exceptional $59,820 |
| Immigrants | Hungary | 99.5 /100 | #80 | Exceptional $59,806 |
| Ukrainians | 99.4 /100 | #81 | Exceptional $59,728 |
| Croatians | 99.4 /100 | #82 | Exceptional $59,715 |
| Immigrants | Italy | 99.4 /100 | #83 | Exceptional $59,691 |
| Afghans | 99.3 /100 | #84 | Exceptional $59,554 |
| Italians | 99.3 /100 | #85 | Exceptional $59,551 |
| Immigrants | England | 99.3 /100 | #86 | Exceptional $59,527 |