Sierra Leonean vs Immigrants from Eritrea 7th Grade
COMPARE
Sierra Leonean
Immigrants from Eritrea
7th Grade
7th Grade Comparison
Sierra Leoneans
Immigrants from Eritrea
96.0%
7TH GRADE
37.5/ 100
METRIC RATING
184th/ 347
METRIC RANK
94.9%
7TH GRADE
0.1/ 100
METRIC RATING
285th/ 347
METRIC RANK
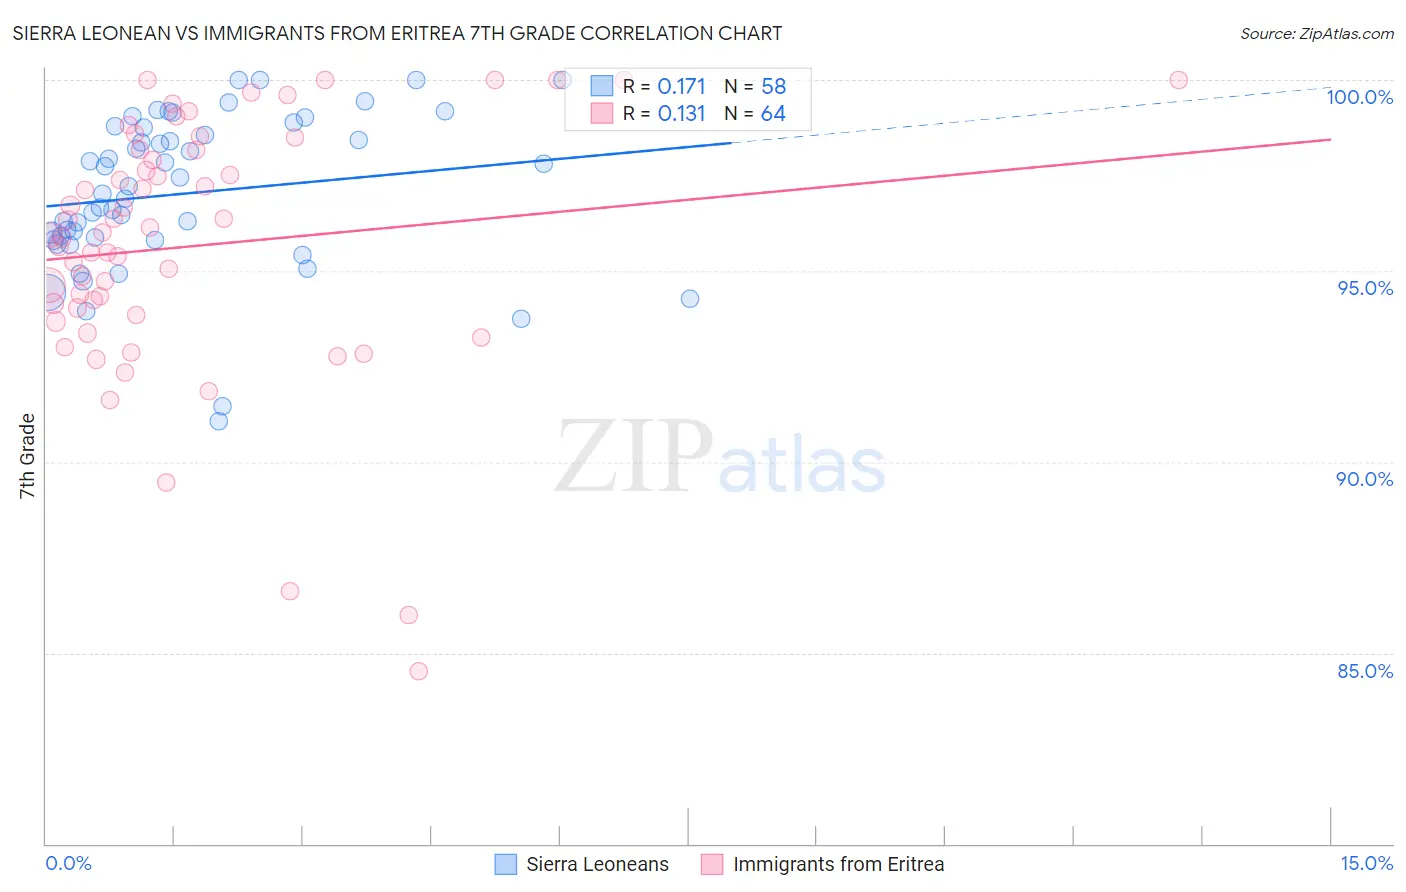
Sierra Leonean vs Immigrants from Eritrea 7th Grade Correlation Chart
The statistical analysis conducted on geographies consisting of 83,337,655 people shows a poor positive correlation between the proportion of Sierra Leoneans and percentage of population with at least 7th grade education in the United States with a correlation coefficient (R) of 0.171 and weighted average of 96.0%. Similarly, the statistical analysis conducted on geographies consisting of 104,754,230 people shows a poor positive correlation between the proportion of Immigrants from Eritrea and percentage of population with at least 7th grade education in the United States with a correlation coefficient (R) of 0.131 and weighted average of 94.9%, a difference of 1.1%.
7th Grade Correlation Summary
| Measurement | Sierra Leonean | Immigrants from Eritrea |
| Minimum | 91.1% | 84.5% |
| Maximum | 100.0% | 100.0% |
| Range | 8.9% | 15.5% |
| Mean | 97.0% | 95.7% |
| Median | 97.1% | 96.0% |
| Interquartile 25% (IQ1) | 95.8% | 93.9% |
| Interquartile 75% (IQ3) | 98.8% | 98.2% |
| Interquartile Range (IQR) | 2.9% | 4.2% |
| Standard Deviation (Sample) | 2.0% | 3.4% |
| Standard Deviation (Population) | 2.0% | 3.3% |
Similar Demographics by 7th Grade
Demographics Similar to Sierra Leoneans by 7th Grade
In terms of 7th grade, the demographic groups most similar to Sierra Leoneans are Brazilian (96.0%, a difference of 0.0%), Immigrants from Spain (96.0%, a difference of 0.010%), Immigrants from Iraq (96.0%, a difference of 0.010%), Immigrants from Uganda (96.0%, a difference of 0.010%), and Iraqi (96.0%, a difference of 0.020%).
| Demographics | Rating | Rank | 7th Grade |
| Immigrants | Korea | 49.2 /100 | #177 | Average 96.0% |
| Marshallese | 48.4 /100 | #178 | Average 96.0% |
| Immigrants | Iran | 47.8 /100 | #179 | Average 96.0% |
| Immigrants | Brazil | 46.8 /100 | #180 | Average 96.0% |
| Pakistanis | 44.5 /100 | #181 | Average 96.0% |
| Iraqis | 41.2 /100 | #182 | Average 96.0% |
| Immigrants | Spain | 38.8 /100 | #183 | Fair 96.0% |
| Sierra Leoneans | 37.5 /100 | #184 | Fair 96.0% |
| Brazilians | 37.3 /100 | #185 | Fair 96.0% |
| Immigrants | Iraq | 36.1 /100 | #186 | Fair 96.0% |
| Immigrants | Uganda | 36.0 /100 | #187 | Fair 96.0% |
| Immigrants | Egypt | 34.3 /100 | #188 | Fair 95.9% |
| Immigrants | Venezuela | 33.9 /100 | #189 | Fair 95.9% |
| Immigrants | Micronesia | 32.6 /100 | #190 | Fair 95.9% |
| Liberians | 32.5 /100 | #191 | Fair 95.9% |
Demographics Similar to Immigrants from Eritrea by 7th Grade
In terms of 7th grade, the demographic groups most similar to Immigrants from Eritrea are Immigrants from Barbados (95.0%, a difference of 0.010%), Armenian (95.0%, a difference of 0.010%), Immigrants from Bolivia (95.0%, a difference of 0.070%), Immigrants from St. Vincent and the Grenadines (95.0%, a difference of 0.080%), and Tohono O'odham (95.0%, a difference of 0.080%).
| Demographics | Rating | Rank | 7th Grade |
| Immigrants | Trinidad and Tobago | 0.1 /100 | #278 | Tragic 95.1% |
| Barbadians | 0.1 /100 | #279 | Tragic 95.1% |
| Immigrants | St. Vincent and the Grenadines | 0.1 /100 | #280 | Tragic 95.0% |
| Tohono O'odham | 0.1 /100 | #281 | Tragic 95.0% |
| Immigrants | Bolivia | 0.1 /100 | #282 | Tragic 95.0% |
| Immigrants | Barbados | 0.1 /100 | #283 | Tragic 95.0% |
| Armenians | 0.1 /100 | #284 | Tragic 95.0% |
| Immigrants | Eritrea | 0.1 /100 | #285 | Tragic 94.9% |
| Immigrants | Philippines | 0.0 /100 | #286 | Tragic 94.9% |
| Immigrants | Peru | 0.0 /100 | #287 | Tragic 94.9% |
| British West Indians | 0.0 /100 | #288 | Tragic 94.8% |
| Taiwanese | 0.0 /100 | #289 | Tragic 94.8% |
| Malaysians | 0.0 /100 | #290 | Tragic 94.8% |
| Immigrants | Grenada | 0.0 /100 | #291 | Tragic 94.8% |
| Immigrants | West Indies | 0.0 /100 | #292 | Tragic 94.8% |