Senegalese vs Indonesian Median Earnings
COMPARE
Senegalese
Indonesian
Median Earnings
Median Earnings Comparison
Senegalese
Indonesians
$44,373
MEDIAN EARNINGS
5.3/ 100
METRIC RATING
239th/ 347
METRIC RANK
$41,701
MEDIAN EARNINGS
0.1/ 100
METRIC RATING
287th/ 347
METRIC RANK
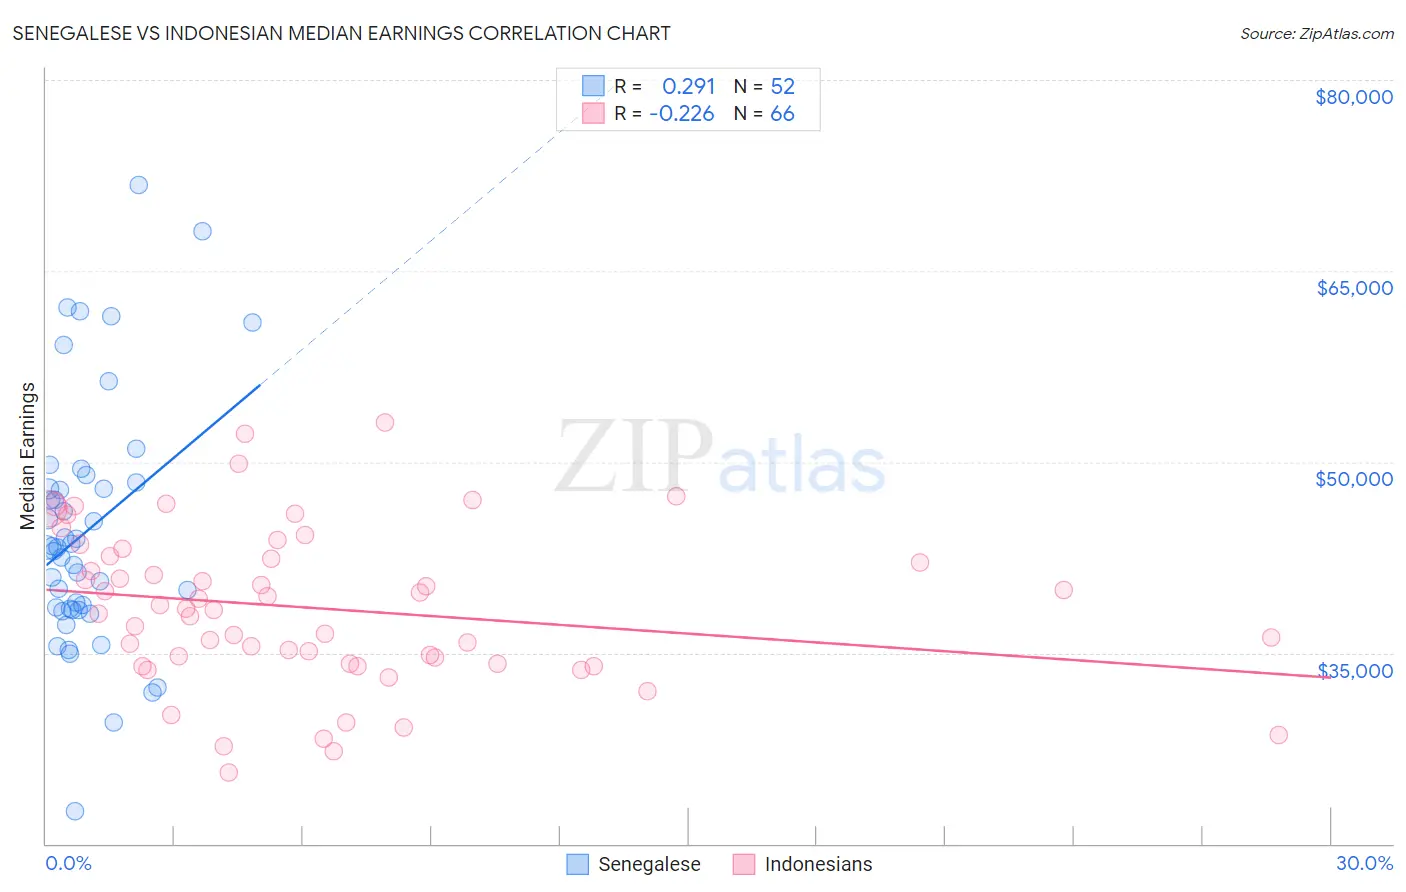
Senegalese vs Indonesian Median Earnings Correlation Chart
The statistical analysis conducted on geographies consisting of 78,107,065 people shows a weak positive correlation between the proportion of Senegalese and median earnings in the United States with a correlation coefficient (R) of 0.291 and weighted average of $44,373. Similarly, the statistical analysis conducted on geographies consisting of 162,738,870 people shows a weak negative correlation between the proportion of Indonesians and median earnings in the United States with a correlation coefficient (R) of -0.226 and weighted average of $41,701, a difference of 6.4%.
Median Earnings Correlation Summary
| Measurement | Senegalese | Indonesian |
| Minimum | $22,537 | $25,580 |
| Maximum | $71,772 | $53,125 |
| Range | $49,235 | $27,545 |
| Mean | $44,574 | $38,511 |
| Median | $43,248 | $38,377 |
| Interquartile 25% (IQ1) | $38,422 | $34,157 |
| Interquartile 75% (IQ3) | $48,145 | $42,572 |
| Interquartile Range (IQR) | $9,723 | $8,415 |
| Standard Deviation (Sample) | $9,701 | $6,165 |
| Standard Deviation (Population) | $9,608 | $6,119 |
Similar Demographics by Median Earnings
Demographics Similar to Senegalese by Median Earnings
In terms of median earnings, the demographic groups most similar to Senegalese are Sudanese ($44,419, a difference of 0.10%), Immigrants from Ecuador ($44,462, a difference of 0.20%), Aleut ($44,241, a difference of 0.30%), Samoan ($44,206, a difference of 0.38%), and British West Indian ($44,552, a difference of 0.40%).
| Demographics | Rating | Rank | Median Earnings |
| Delaware | 9.0 /100 | #232 | Tragic $44,783 |
| Immigrants | Sudan | 8.8 /100 | #233 | Tragic $44,767 |
| Cape Verdeans | 7.5 /100 | #234 | Tragic $44,640 |
| Venezuelans | 6.9 /100 | #235 | Tragic $44,580 |
| British West Indians | 6.7 /100 | #236 | Tragic $44,552 |
| Immigrants | Ecuador | 5.9 /100 | #237 | Tragic $44,462 |
| Sudanese | 5.6 /100 | #238 | Tragic $44,419 |
| Senegalese | 5.3 /100 | #239 | Tragic $44,373 |
| Aleuts | 4.4 /100 | #240 | Tragic $44,241 |
| Samoans | 4.2 /100 | #241 | Tragic $44,206 |
| Immigrants | Venezuela | 4.0 /100 | #242 | Tragic $44,163 |
| Sub-Saharan Africans | 3.7 /100 | #243 | Tragic $44,118 |
| Immigrants | Nonimmigrants | 3.7 /100 | #244 | Tragic $44,117 |
| Immigrants | Burma/Myanmar | 3.2 /100 | #245 | Tragic $43,998 |
| Immigrants | West Indies | 3.1 /100 | #246 | Tragic $43,989 |
Demographics Similar to Indonesians by Median Earnings
In terms of median earnings, the demographic groups most similar to Indonesians are Mexican American Indian ($41,719, a difference of 0.040%), Immigrants from Nicaragua ($41,737, a difference of 0.090%), Blackfeet ($41,822, a difference of 0.29%), Immigrants from Dominican Republic ($41,554, a difference of 0.35%), and Dominican ($41,864, a difference of 0.39%).
| Demographics | Rating | Rank | Median Earnings |
| Hmong | 0.2 /100 | #280 | Tragic $42,111 |
| Marshallese | 0.2 /100 | #281 | Tragic $41,969 |
| Africans | 0.2 /100 | #282 | Tragic $41,955 |
| Dominicans | 0.2 /100 | #283 | Tragic $41,864 |
| Blackfeet | 0.2 /100 | #284 | Tragic $41,822 |
| Immigrants | Nicaragua | 0.1 /100 | #285 | Tragic $41,737 |
| Mexican American Indians | 0.1 /100 | #286 | Tragic $41,719 |
| Indonesians | 0.1 /100 | #287 | Tragic $41,701 |
| Immigrants | Dominican Republic | 0.1 /100 | #288 | Tragic $41,554 |
| Comanche | 0.1 /100 | #289 | Tragic $41,519 |
| Paiute | 0.1 /100 | #290 | Tragic $41,508 |
| Central American Indians | 0.1 /100 | #291 | Tragic $41,474 |
| U.S. Virgin Islanders | 0.1 /100 | #292 | Tragic $41,448 |
| Immigrants | Zaire | 0.1 /100 | #293 | Tragic $41,325 |
| Potawatomi | 0.1 /100 | #294 | Tragic $41,288 |