Scottish vs Indonesian Median Earnings
COMPARE
Scottish
Indonesian
Median Earnings
Median Earnings Comparison
Scottish
Indonesians
$46,463
MEDIAN EARNINGS
51.1/ 100
METRIC RATING
171st/ 347
METRIC RANK
$41,701
MEDIAN EARNINGS
0.1/ 100
METRIC RATING
287th/ 347
METRIC RANK
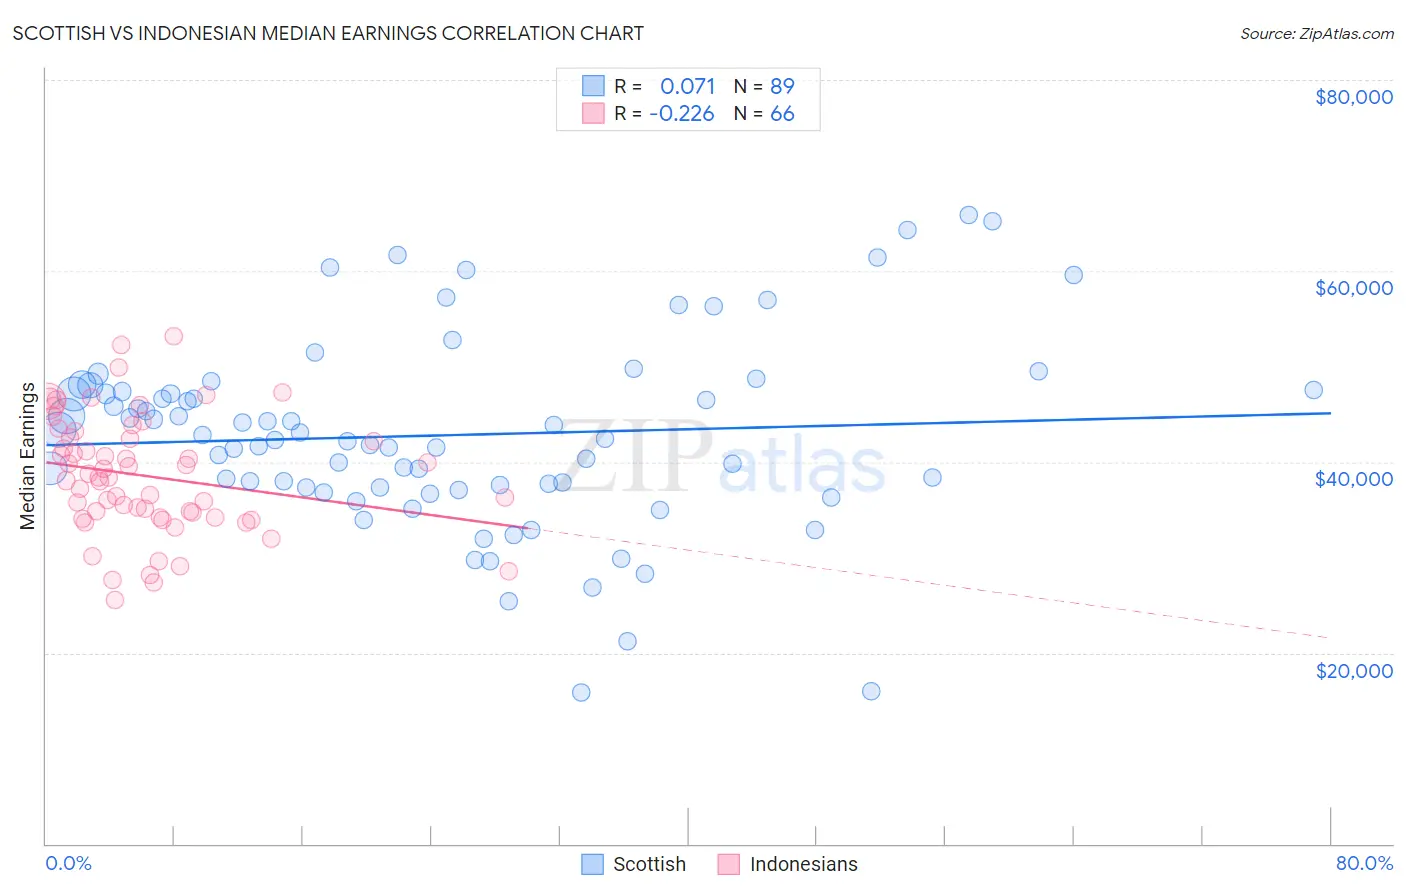
Scottish vs Indonesian Median Earnings Correlation Chart
The statistical analysis conducted on geographies consisting of 566,727,136 people shows a slight positive correlation between the proportion of Scottish and median earnings in the United States with a correlation coefficient (R) of 0.071 and weighted average of $46,463. Similarly, the statistical analysis conducted on geographies consisting of 162,738,870 people shows a weak negative correlation between the proportion of Indonesians and median earnings in the United States with a correlation coefficient (R) of -0.226 and weighted average of $41,701, a difference of 11.4%.
Median Earnings Correlation Summary
| Measurement | Scottish | Indonesian |
| Minimum | $15,833 | $25,580 |
| Maximum | $65,898 | $53,125 |
| Range | $50,065 | $27,545 |
| Mean | $42,786 | $38,511 |
| Median | $42,413 | $38,377 |
| Interquartile 25% (IQ1) | $37,295 | $34,157 |
| Interquartile 75% (IQ3) | $47,447 | $42,572 |
| Interquartile Range (IQR) | $10,152 | $8,415 |
| Standard Deviation (Sample) | $10,003 | $6,165 |
| Standard Deviation (Population) | $9,946 | $6,119 |
Similar Demographics by Median Earnings
Demographics Similar to Scottish by Median Earnings
In terms of median earnings, the demographic groups most similar to Scottish are Kenyan ($46,462, a difference of 0.0%), Immigrants ($46,478, a difference of 0.030%), Ghanaian ($46,440, a difference of 0.050%), Scandinavian ($46,433, a difference of 0.060%), and Basque ($46,399, a difference of 0.14%).
| Demographics | Rating | Rank | Median Earnings |
| Norwegians | 64.7 /100 | #164 | Good $46,865 |
| South Americans | 62.7 /100 | #165 | Good $46,804 |
| Czechoslovakians | 57.8 /100 | #166 | Average $46,658 |
| Costa Ricans | 57.4 /100 | #167 | Average $46,645 |
| Immigrants | Africa | 54.6 /100 | #168 | Average $46,564 |
| Immigrants | South America | 54.0 /100 | #169 | Average $46,548 |
| Immigrants | Immigrants | 51.6 /100 | #170 | Average $46,478 |
| Scottish | 51.1 /100 | #171 | Average $46,463 |
| Kenyans | 51.0 /100 | #172 | Average $46,462 |
| Ghanaians | 50.3 /100 | #173 | Average $46,440 |
| Scandinavians | 50.0 /100 | #174 | Average $46,433 |
| Basques | 48.8 /100 | #175 | Average $46,399 |
| Danes | 48.6 /100 | #176 | Average $46,392 |
| Belgians | 48.0 /100 | #177 | Average $46,375 |
| Colombians | 47.1 /100 | #178 | Average $46,349 |
Demographics Similar to Indonesians by Median Earnings
In terms of median earnings, the demographic groups most similar to Indonesians are Mexican American Indian ($41,719, a difference of 0.040%), Immigrants from Nicaragua ($41,737, a difference of 0.090%), Blackfeet ($41,822, a difference of 0.29%), Immigrants from Dominican Republic ($41,554, a difference of 0.35%), and Dominican ($41,864, a difference of 0.39%).
| Demographics | Rating | Rank | Median Earnings |
| Hmong | 0.2 /100 | #280 | Tragic $42,111 |
| Marshallese | 0.2 /100 | #281 | Tragic $41,969 |
| Africans | 0.2 /100 | #282 | Tragic $41,955 |
| Dominicans | 0.2 /100 | #283 | Tragic $41,864 |
| Blackfeet | 0.2 /100 | #284 | Tragic $41,822 |
| Immigrants | Nicaragua | 0.1 /100 | #285 | Tragic $41,737 |
| Mexican American Indians | 0.1 /100 | #286 | Tragic $41,719 |
| Indonesians | 0.1 /100 | #287 | Tragic $41,701 |
| Immigrants | Dominican Republic | 0.1 /100 | #288 | Tragic $41,554 |
| Comanche | 0.1 /100 | #289 | Tragic $41,519 |
| Paiute | 0.1 /100 | #290 | Tragic $41,508 |
| Central American Indians | 0.1 /100 | #291 | Tragic $41,474 |
| U.S. Virgin Islanders | 0.1 /100 | #292 | Tragic $41,448 |
| Immigrants | Zaire | 0.1 /100 | #293 | Tragic $41,325 |
| Potawatomi | 0.1 /100 | #294 | Tragic $41,288 |