Senegalese vs Ecuadorian Median Earnings
COMPARE
Senegalese
Ecuadorian
Median Earnings
Median Earnings Comparison
Senegalese
Ecuadorians
$44,373
MEDIAN EARNINGS
5.3/ 100
METRIC RATING
239th/ 347
METRIC RANK
$45,214
MEDIAN EARNINGS
15.3/ 100
METRIC RATING
220th/ 347
METRIC RANK
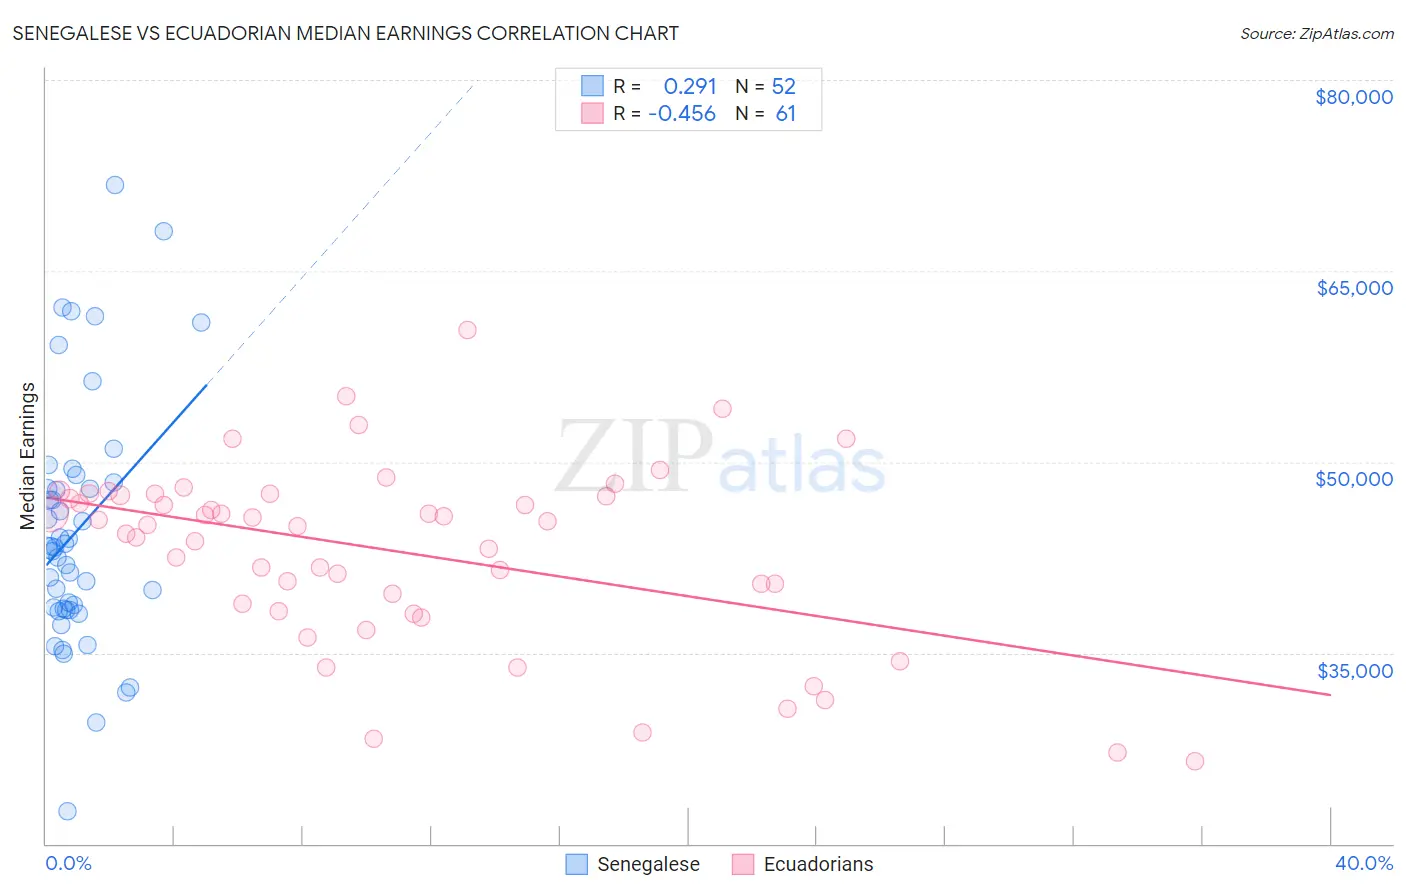
Senegalese vs Ecuadorian Median Earnings Correlation Chart
The statistical analysis conducted on geographies consisting of 78,107,065 people shows a weak positive correlation between the proportion of Senegalese and median earnings in the United States with a correlation coefficient (R) of 0.291 and weighted average of $44,373. Similarly, the statistical analysis conducted on geographies consisting of 317,848,977 people shows a moderate negative correlation between the proportion of Ecuadorians and median earnings in the United States with a correlation coefficient (R) of -0.456 and weighted average of $45,214, a difference of 1.9%.
Median Earnings Correlation Summary
| Measurement | Senegalese | Ecuadorian |
| Minimum | $22,537 | $26,500 |
| Maximum | $71,772 | $60,377 |
| Range | $49,235 | $33,877 |
| Mean | $44,574 | $42,954 |
| Median | $43,248 | $45,047 |
| Interquartile 25% (IQ1) | $38,422 | $38,574 |
| Interquartile 75% (IQ3) | $48,145 | $47,434 |
| Interquartile Range (IQR) | $9,723 | $8,860 |
| Standard Deviation (Sample) | $9,701 | $7,114 |
| Standard Deviation (Population) | $9,608 | $7,055 |
Demographics Similar to Senegalese and Ecuadorians by Median Earnings
In terms of median earnings, the demographic groups most similar to Senegalese are Sudanese ($44,419, a difference of 0.10%), Immigrants from Ecuador ($44,462, a difference of 0.20%), British West Indian ($44,552, a difference of 0.40%), Venezuelan ($44,580, a difference of 0.47%), and Cape Verdean ($44,640, a difference of 0.60%). Similarly, the demographic groups most similar to Ecuadorians are Immigrants from Guyana ($45,204, a difference of 0.020%), Immigrants from Panama ($45,198, a difference of 0.030%), White/Caucasian ($45,197, a difference of 0.040%), West Indian ($45,132, a difference of 0.18%), and Immigrants from Cambodia ($45,090, a difference of 0.28%).
| Demographics | Rating | Rank | Median Earnings |
| Dutch | 18.4 /100 | #219 | Poor $45,370 |
| Ecuadorians | 15.3 /100 | #220 | Poor $45,214 |
| Immigrants | Guyana | 15.1 /100 | #221 | Poor $45,204 |
| Immigrants | Panama | 15.0 /100 | #222 | Poor $45,198 |
| Whites/Caucasians | 15.0 /100 | #223 | Poor $45,197 |
| West Indians | 13.9 /100 | #224 | Poor $45,132 |
| Immigrants | Cambodia | 13.2 /100 | #225 | Poor $45,090 |
| Immigrants | Nigeria | 12.2 /100 | #226 | Poor $45,030 |
| Native Hawaiians | 12.2 /100 | #227 | Poor $45,027 |
| Immigrants | Iraq | 11.6 /100 | #228 | Poor $44,988 |
| Scotch-Irish | 10.7 /100 | #229 | Poor $44,924 |
| Immigrants | Western Africa | 10.3 /100 | #230 | Poor $44,893 |
| Japanese | 9.5 /100 | #231 | Tragic $44,825 |
| Delaware | 9.0 /100 | #232 | Tragic $44,783 |
| Immigrants | Sudan | 8.8 /100 | #233 | Tragic $44,767 |
| Cape Verdeans | 7.5 /100 | #234 | Tragic $44,640 |
| Venezuelans | 6.9 /100 | #235 | Tragic $44,580 |
| British West Indians | 6.7 /100 | #236 | Tragic $44,552 |
| Immigrants | Ecuador | 5.9 /100 | #237 | Tragic $44,462 |
| Sudanese | 5.6 /100 | #238 | Tragic $44,419 |
| Senegalese | 5.3 /100 | #239 | Tragic $44,373 |