Senegalese vs Indonesian Ambulatory Disability
COMPARE
Senegalese
Indonesian
Ambulatory Disability
Ambulatory Disability Comparison
Senegalese
Indonesians
6.4%
AMBULATORY DISABILITY
1.7/ 100
METRIC RATING
239th/ 347
METRIC RANK
6.3%
AMBULATORY DISABILITY
9.9/ 100
METRIC RATING
219th/ 347
METRIC RANK
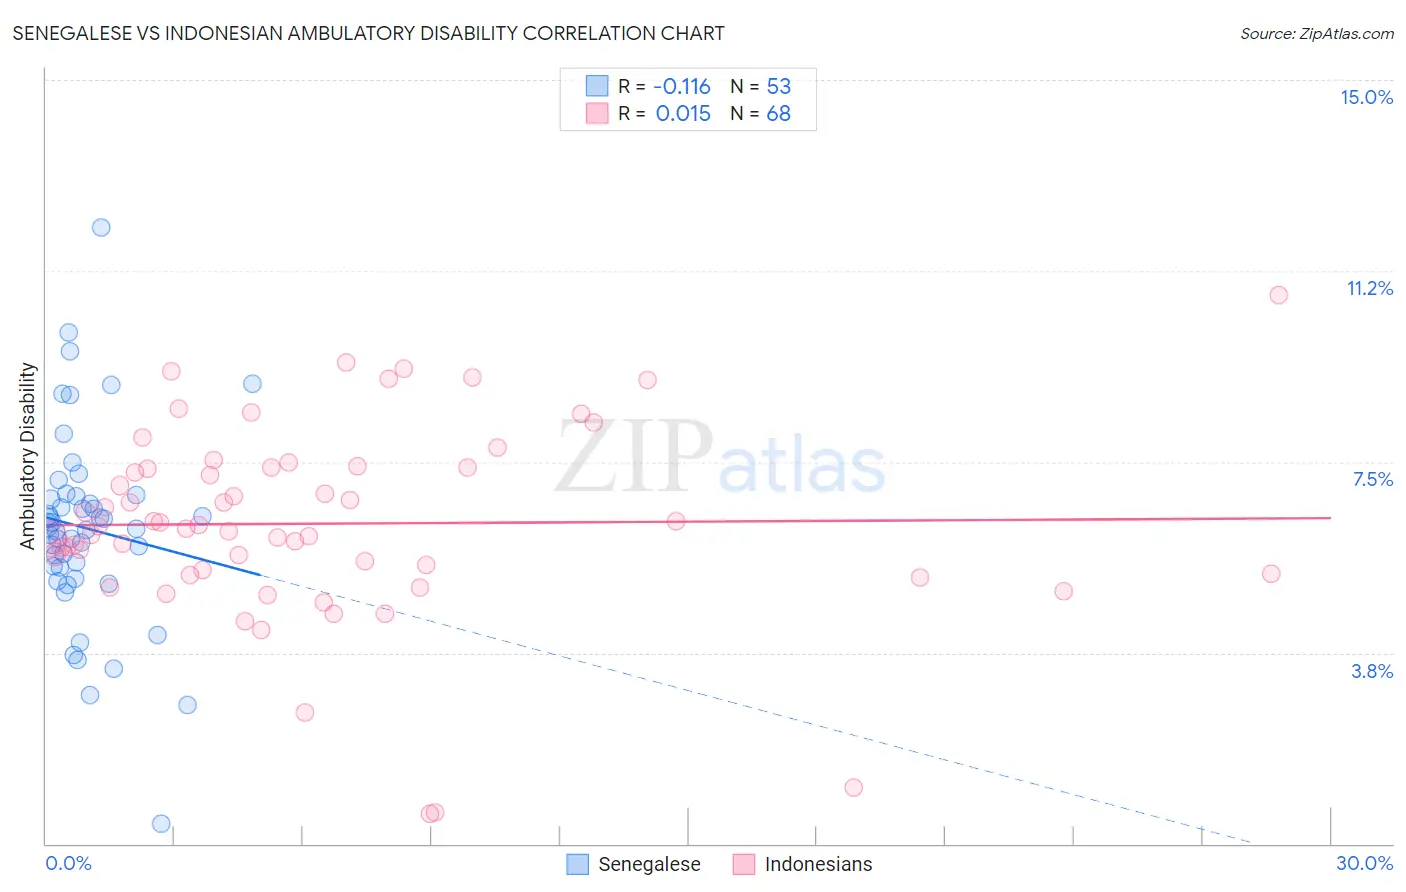
Senegalese vs Indonesian Ambulatory Disability Correlation Chart
The statistical analysis conducted on geographies consisting of 78,138,068 people shows a poor negative correlation between the proportion of Senegalese and percentage of population with ambulatory disability in the United States with a correlation coefficient (R) of -0.116 and weighted average of 6.4%. Similarly, the statistical analysis conducted on geographies consisting of 162,682,177 people shows no correlation between the proportion of Indonesians and percentage of population with ambulatory disability in the United States with a correlation coefficient (R) of 0.015 and weighted average of 6.3%, a difference of 2.4%.
Ambulatory Disability Correlation Summary
| Measurement | Senegalese | Indonesian |
| Minimum | 0.40% | 0.59% |
| Maximum | 12.1% | 10.8% |
| Range | 11.7% | 10.2% |
| Mean | 6.2% | 6.3% |
| Median | 6.2% | 6.2% |
| Interquartile 25% (IQ1) | 5.3% | 5.3% |
| Interquartile 75% (IQ3) | 6.8% | 7.4% |
| Interquartile Range (IQR) | 1.5% | 2.1% |
| Standard Deviation (Sample) | 1.9% | 1.9% |
| Standard Deviation (Population) | 1.9% | 1.9% |
Demographics Similar to Senegalese and Indonesians by Ambulatory Disability
In terms of ambulatory disability, the demographic groups most similar to Senegalese are Haitian (6.4%, a difference of 0.070%), Immigrants from Germany (6.4%, a difference of 0.080%), Dutch (6.4%, a difference of 0.16%), Hispanic or Latino (6.4%, a difference of 0.32%), and Immigrants from Liberia (6.4%, a difference of 0.35%). Similarly, the demographic groups most similar to Indonesians are Immigrants from Albania (6.3%, a difference of 0.040%), Hungarian (6.3%, a difference of 0.050%), German Russian (6.3%, a difference of 0.070%), Immigrants from Honduras (6.3%, a difference of 0.37%), and Liberian (6.3%, a difference of 0.46%).
| Demographics | Rating | Rank | Ambulatory Disability |
| Indonesians | 9.9 /100 | #219 | Tragic 6.3% |
| Immigrants | Albania | 9.6 /100 | #220 | Tragic 6.3% |
| Hungarians | 9.6 /100 | #221 | Tragic 6.3% |
| German Russians | 9.4 /100 | #222 | Tragic 6.3% |
| Immigrants | Honduras | 7.6 /100 | #223 | Tragic 6.3% |
| Liberians | 7.1 /100 | #224 | Tragic 6.3% |
| Hondurans | 6.3 /100 | #225 | Tragic 6.3% |
| Slavs | 5.1 /100 | #226 | Tragic 6.4% |
| Cubans | 4.0 /100 | #227 | Tragic 6.4% |
| Portuguese | 4.0 /100 | #228 | Tragic 6.4% |
| Czechoslovakians | 3.8 /100 | #229 | Tragic 6.4% |
| Mexicans | 3.5 /100 | #230 | Tragic 6.4% |
| Panamanians | 3.1 /100 | #231 | Tragic 6.4% |
| Assyrians/Chaldeans/Syriacs | 2.4 /100 | #232 | Tragic 6.4% |
| Sub-Saharan Africans | 2.3 /100 | #233 | Tragic 6.4% |
| Immigrants | Liberia | 2.3 /100 | #234 | Tragic 6.4% |
| Hispanics or Latinos | 2.2 /100 | #235 | Tragic 6.4% |
| Dutch | 2.0 /100 | #236 | Tragic 6.4% |
| Immigrants | Germany | 1.8 /100 | #237 | Tragic 6.4% |
| Haitians | 1.8 /100 | #238 | Tragic 6.4% |
| Senegalese | 1.7 /100 | #239 | Tragic 6.4% |