Portuguese vs Indonesian Median Earnings
COMPARE
Portuguese
Indonesian
Median Earnings
Median Earnings Comparison
Portuguese
Indonesians
$48,032
MEDIAN EARNINGS
90.4/ 100
METRIC RATING
135th/ 347
METRIC RANK
$41,701
MEDIAN EARNINGS
0.1/ 100
METRIC RATING
287th/ 347
METRIC RANK
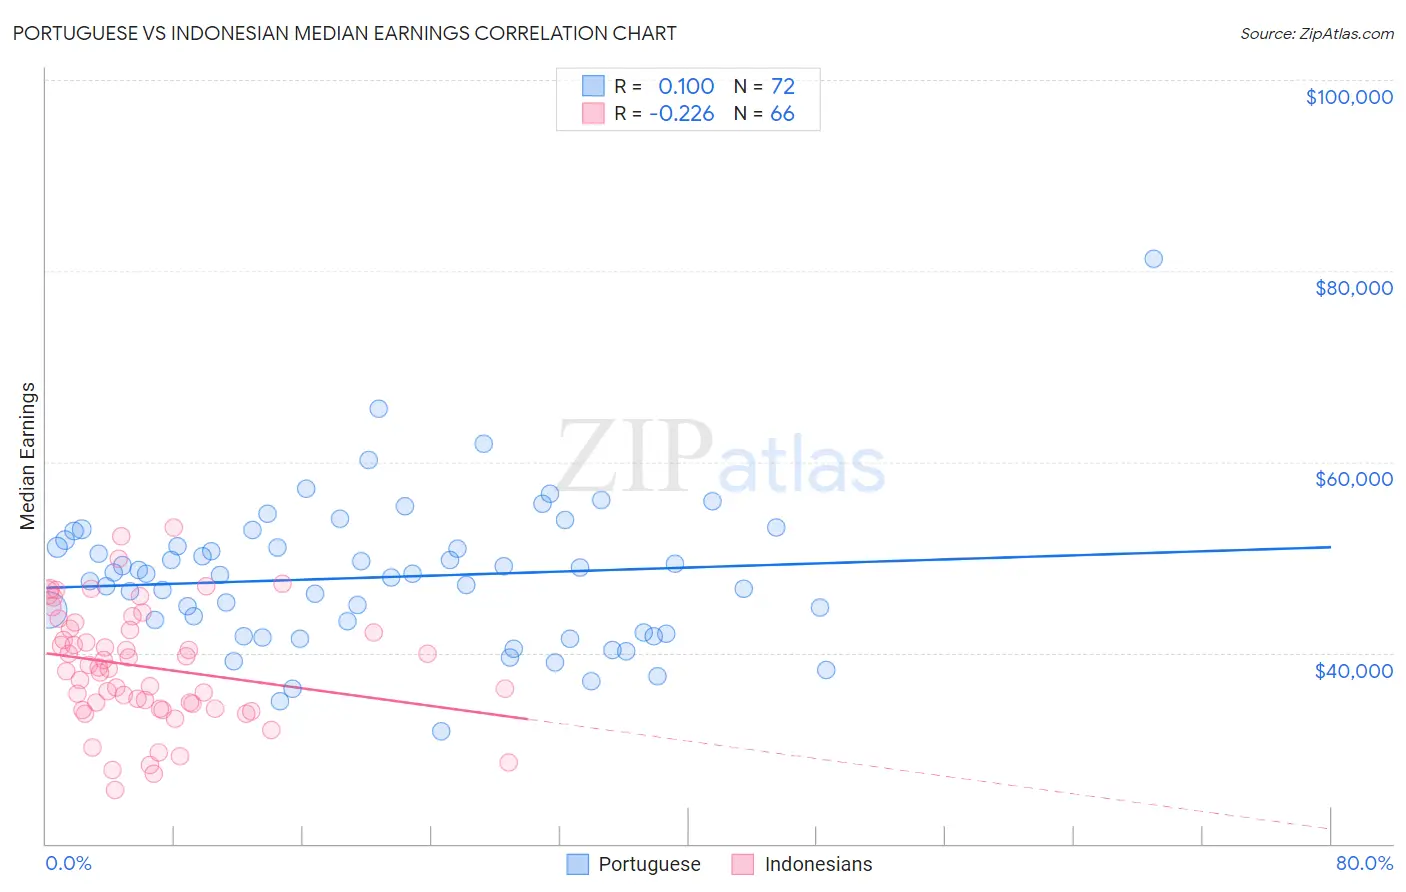
Portuguese vs Indonesian Median Earnings Correlation Chart
The statistical analysis conducted on geographies consisting of 450,292,594 people shows a poor positive correlation between the proportion of Portuguese and median earnings in the United States with a correlation coefficient (R) of 0.100 and weighted average of $48,032. Similarly, the statistical analysis conducted on geographies consisting of 162,738,870 people shows a weak negative correlation between the proportion of Indonesians and median earnings in the United States with a correlation coefficient (R) of -0.226 and weighted average of $41,701, a difference of 15.2%.
Median Earnings Correlation Summary
| Measurement | Portuguese | Indonesian |
| Minimum | $31,738 | $25,580 |
| Maximum | $81,250 | $53,125 |
| Range | $49,512 | $27,545 |
| Mean | $47,922 | $38,511 |
| Median | $48,184 | $38,377 |
| Interquartile 25% (IQ1) | $42,050 | $34,157 |
| Interquartile 75% (IQ3) | $51,472 | $42,572 |
| Interquartile Range (IQR) | $9,423 | $8,415 |
| Standard Deviation (Sample) | $7,646 | $6,165 |
| Standard Deviation (Population) | $7,593 | $6,119 |
Similar Demographics by Median Earnings
Demographics Similar to Portuguese by Median Earnings
In terms of median earnings, the demographic groups most similar to Portuguese are Immigrants from Uganda ($48,041, a difference of 0.020%), Sri Lankan ($48,040, a difference of 0.020%), Slovene ($47,995, a difference of 0.080%), Immigrants from Nepal ($47,925, a difference of 0.22%), and European ($47,915, a difference of 0.25%).
| Demographics | Rating | Rank | Median Earnings |
| Immigrants | Philippines | 92.9 /100 | #128 | Exceptional $48,266 |
| Pakistanis | 92.8 /100 | #129 | Exceptional $48,254 |
| Zimbabweans | 92.6 /100 | #130 | Exceptional $48,229 |
| Lebanese | 92.5 /100 | #131 | Exceptional $48,226 |
| British | 92.2 /100 | #132 | Exceptional $48,189 |
| Immigrants | Uganda | 90.5 /100 | #133 | Exceptional $48,041 |
| Sri Lankans | 90.5 /100 | #134 | Exceptional $48,040 |
| Portuguese | 90.4 /100 | #135 | Exceptional $48,032 |
| Slovenes | 90.0 /100 | #136 | Excellent $47,995 |
| Immigrants | Nepal | 89.0 /100 | #137 | Excellent $47,925 |
| Europeans | 88.9 /100 | #138 | Excellent $47,915 |
| Canadians | 88.8 /100 | #139 | Excellent $47,911 |
| Taiwanese | 88.7 /100 | #140 | Excellent $47,902 |
| Immigrants | Sierra Leone | 88.3 /100 | #141 | Excellent $47,875 |
| Ugandans | 88.0 /100 | #142 | Excellent $47,854 |
Demographics Similar to Indonesians by Median Earnings
In terms of median earnings, the demographic groups most similar to Indonesians are Mexican American Indian ($41,719, a difference of 0.040%), Immigrants from Nicaragua ($41,737, a difference of 0.090%), Blackfeet ($41,822, a difference of 0.29%), Immigrants from Dominican Republic ($41,554, a difference of 0.35%), and Dominican ($41,864, a difference of 0.39%).
| Demographics | Rating | Rank | Median Earnings |
| Hmong | 0.2 /100 | #280 | Tragic $42,111 |
| Marshallese | 0.2 /100 | #281 | Tragic $41,969 |
| Africans | 0.2 /100 | #282 | Tragic $41,955 |
| Dominicans | 0.2 /100 | #283 | Tragic $41,864 |
| Blackfeet | 0.2 /100 | #284 | Tragic $41,822 |
| Immigrants | Nicaragua | 0.1 /100 | #285 | Tragic $41,737 |
| Mexican American Indians | 0.1 /100 | #286 | Tragic $41,719 |
| Indonesians | 0.1 /100 | #287 | Tragic $41,701 |
| Immigrants | Dominican Republic | 0.1 /100 | #288 | Tragic $41,554 |
| Comanche | 0.1 /100 | #289 | Tragic $41,519 |
| Paiute | 0.1 /100 | #290 | Tragic $41,508 |
| Central American Indians | 0.1 /100 | #291 | Tragic $41,474 |
| U.S. Virgin Islanders | 0.1 /100 | #292 | Tragic $41,448 |
| Immigrants | Zaire | 0.1 /100 | #293 | Tragic $41,325 |
| Potawatomi | 0.1 /100 | #294 | Tragic $41,288 |