Tsimshian vs Indonesian Median Earnings
COMPARE
Tsimshian
Indonesian
Median Earnings
Median Earnings Comparison
Tsimshian
Indonesians
$43,695
MEDIAN EARNINGS
2.1/ 100
METRIC RATING
251st/ 347
METRIC RANK
$41,701
MEDIAN EARNINGS
0.1/ 100
METRIC RATING
287th/ 347
METRIC RANK
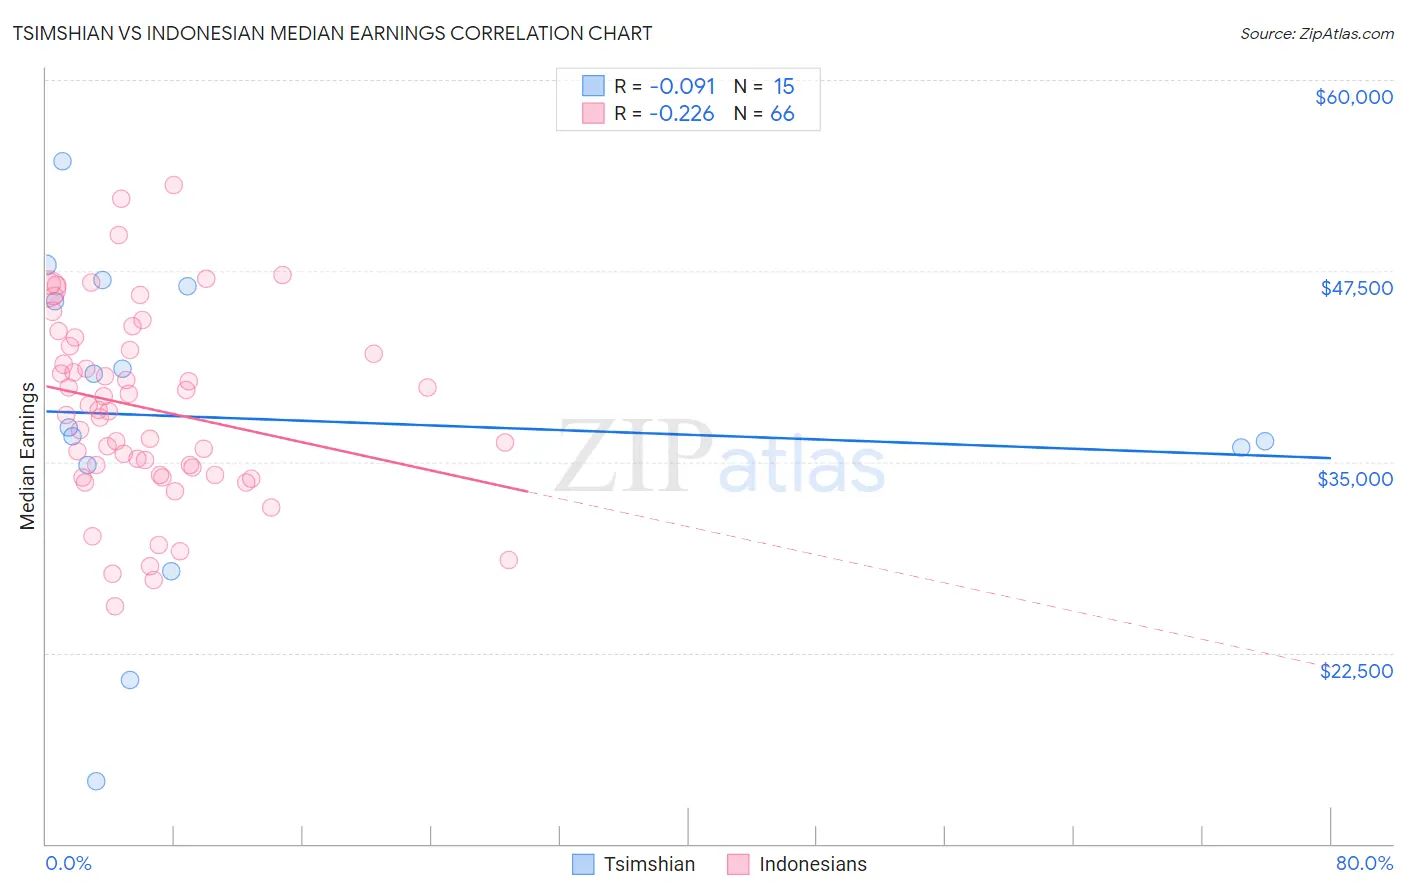
Tsimshian vs Indonesian Median Earnings Correlation Chart
The statistical analysis conducted on geographies consisting of 15,626,544 people shows a slight negative correlation between the proportion of Tsimshian and median earnings in the United States with a correlation coefficient (R) of -0.091 and weighted average of $43,695. Similarly, the statistical analysis conducted on geographies consisting of 162,738,870 people shows a weak negative correlation between the proportion of Indonesians and median earnings in the United States with a correlation coefficient (R) of -0.226 and weighted average of $41,701, a difference of 4.8%.
Median Earnings Correlation Summary
| Measurement | Tsimshian | Indonesian |
| Minimum | $14,091 | $25,580 |
| Maximum | $54,691 | $53,125 |
| Range | $40,600 | $27,545 |
| Mean | $37,810 | $38,511 |
| Median | $37,241 | $38,377 |
| Interquartile 25% (IQ1) | $34,814 | $34,157 |
| Interquartile 75% (IQ3) | $46,528 | $42,572 |
| Interquartile Range (IQR) | $11,714 | $8,415 |
| Standard Deviation (Sample) | $10,670 | $6,165 |
| Standard Deviation (Population) | $10,309 | $6,119 |
Similar Demographics by Median Earnings
Demographics Similar to Tsimshian by Median Earnings
In terms of median earnings, the demographic groups most similar to Tsimshian are Hawaiian ($43,673, a difference of 0.050%), Alaska Native ($43,750, a difference of 0.13%), Somali ($43,567, a difference of 0.30%), Malaysian ($43,844, a difference of 0.34%), and Liberian ($43,536, a difference of 0.37%).
| Demographics | Rating | Rank | Median Earnings |
| Immigrants | Nonimmigrants | 3.7 /100 | #244 | Tragic $44,117 |
| Immigrants | Burma/Myanmar | 3.2 /100 | #245 | Tragic $43,998 |
| Immigrants | West Indies | 3.1 /100 | #246 | Tragic $43,989 |
| Immigrants | Cabo Verde | 3.0 /100 | #247 | Tragic $43,963 |
| Nepalese | 2.6 /100 | #248 | Tragic $43,860 |
| Malaysians | 2.6 /100 | #249 | Tragic $43,844 |
| Alaska Natives | 2.3 /100 | #250 | Tragic $43,750 |
| Tsimshian | 2.1 /100 | #251 | Tragic $43,695 |
| Hawaiians | 2.0 /100 | #252 | Tragic $43,673 |
| Somalis | 1.8 /100 | #253 | Tragic $43,567 |
| Liberians | 1.7 /100 | #254 | Tragic $43,536 |
| Immigrants | Middle Africa | 1.4 /100 | #255 | Tragic $43,416 |
| Alaskan Athabascans | 1.4 /100 | #256 | Tragic $43,393 |
| Jamaicans | 1.3 /100 | #257 | Tragic $43,343 |
| French American Indians | 1.3 /100 | #258 | Tragic $43,333 |
Demographics Similar to Indonesians by Median Earnings
In terms of median earnings, the demographic groups most similar to Indonesians are Mexican American Indian ($41,719, a difference of 0.040%), Immigrants from Nicaragua ($41,737, a difference of 0.090%), Blackfeet ($41,822, a difference of 0.29%), Immigrants from Dominican Republic ($41,554, a difference of 0.35%), and Dominican ($41,864, a difference of 0.39%).
| Demographics | Rating | Rank | Median Earnings |
| Hmong | 0.2 /100 | #280 | Tragic $42,111 |
| Marshallese | 0.2 /100 | #281 | Tragic $41,969 |
| Africans | 0.2 /100 | #282 | Tragic $41,955 |
| Dominicans | 0.2 /100 | #283 | Tragic $41,864 |
| Blackfeet | 0.2 /100 | #284 | Tragic $41,822 |
| Immigrants | Nicaragua | 0.1 /100 | #285 | Tragic $41,737 |
| Mexican American Indians | 0.1 /100 | #286 | Tragic $41,719 |
| Indonesians | 0.1 /100 | #287 | Tragic $41,701 |
| Immigrants | Dominican Republic | 0.1 /100 | #288 | Tragic $41,554 |
| Comanche | 0.1 /100 | #289 | Tragic $41,519 |
| Paiute | 0.1 /100 | #290 | Tragic $41,508 |
| Central American Indians | 0.1 /100 | #291 | Tragic $41,474 |
| U.S. Virgin Islanders | 0.1 /100 | #292 | Tragic $41,448 |
| Immigrants | Zaire | 0.1 /100 | #293 | Tragic $41,325 |
| Potawatomi | 0.1 /100 | #294 | Tragic $41,288 |