Senegalese vs Honduran Median Earnings
COMPARE
Senegalese
Honduran
Median Earnings
Median Earnings Comparison
Senegalese
Hondurans
$44,373
MEDIAN EARNINGS
5.3/ 100
METRIC RATING
239th/ 347
METRIC RANK
$40,638
MEDIAN EARNINGS
0.0/ 100
METRIC RATING
307th/ 347
METRIC RANK
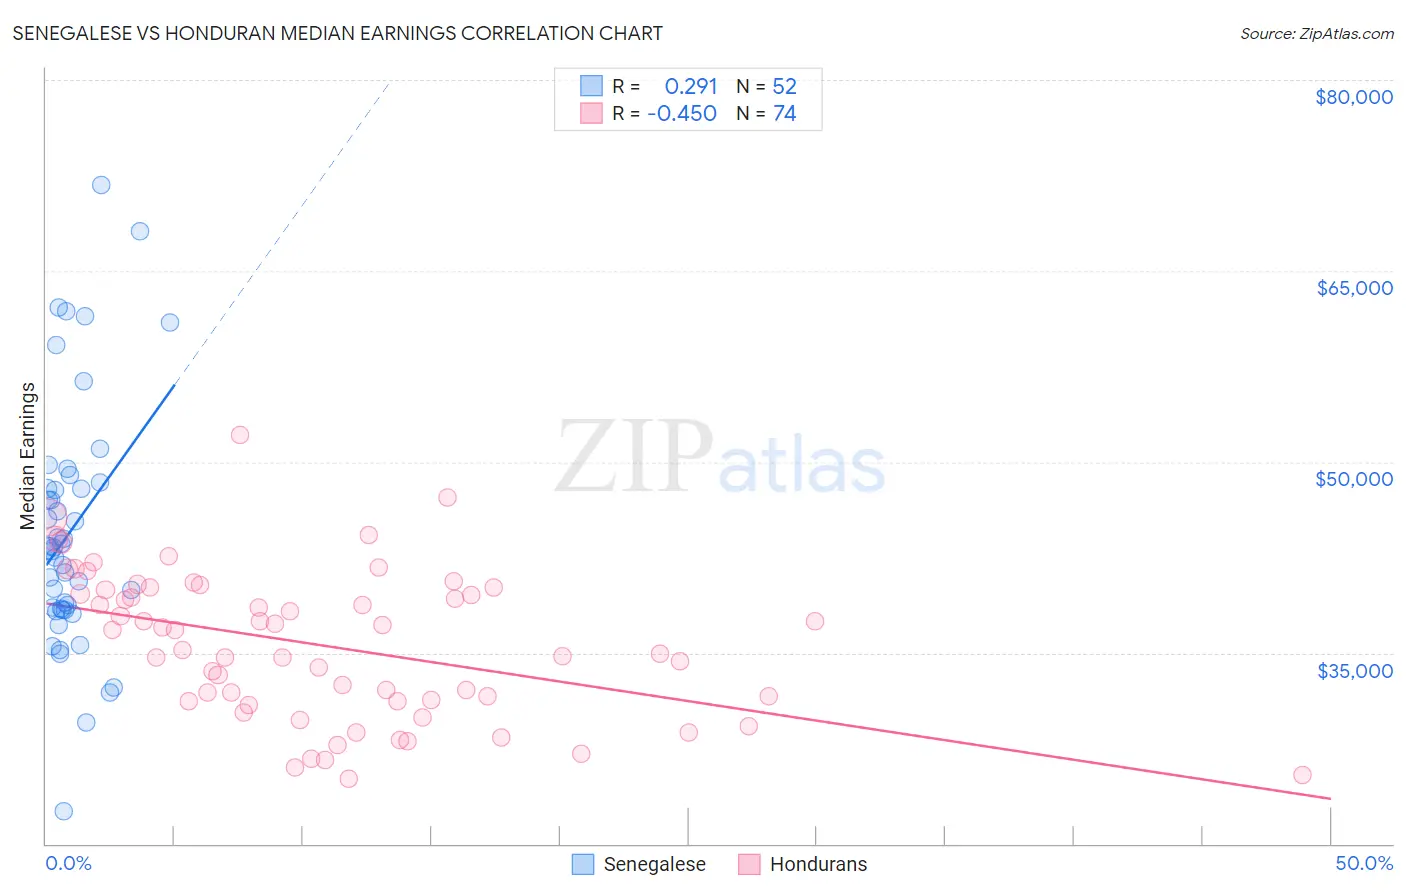
Senegalese vs Honduran Median Earnings Correlation Chart
The statistical analysis conducted on geographies consisting of 78,107,065 people shows a weak positive correlation between the proportion of Senegalese and median earnings in the United States with a correlation coefficient (R) of 0.291 and weighted average of $44,373. Similarly, the statistical analysis conducted on geographies consisting of 357,850,602 people shows a moderate negative correlation between the proportion of Hondurans and median earnings in the United States with a correlation coefficient (R) of -0.450 and weighted average of $40,638, a difference of 9.2%.
Median Earnings Correlation Summary
| Measurement | Senegalese | Honduran |
| Minimum | $22,537 | $25,151 |
| Maximum | $71,772 | $52,125 |
| Range | $49,235 | $26,974 |
| Mean | $44,574 | $35,597 |
| Median | $43,248 | $35,991 |
| Interquartile 25% (IQ1) | $38,422 | $31,224 |
| Interquartile 75% (IQ3) | $48,145 | $39,973 |
| Interquartile Range (IQR) | $9,723 | $8,749 |
| Standard Deviation (Sample) | $9,701 | $5,768 |
| Standard Deviation (Population) | $9,608 | $5,729 |
Similar Demographics by Median Earnings
Demographics Similar to Senegalese by Median Earnings
In terms of median earnings, the demographic groups most similar to Senegalese are Sudanese ($44,419, a difference of 0.10%), Immigrants from Ecuador ($44,462, a difference of 0.20%), Aleut ($44,241, a difference of 0.30%), Samoan ($44,206, a difference of 0.38%), and British West Indian ($44,552, a difference of 0.40%).
| Demographics | Rating | Rank | Median Earnings |
| Delaware | 9.0 /100 | #232 | Tragic $44,783 |
| Immigrants | Sudan | 8.8 /100 | #233 | Tragic $44,767 |
| Cape Verdeans | 7.5 /100 | #234 | Tragic $44,640 |
| Venezuelans | 6.9 /100 | #235 | Tragic $44,580 |
| British West Indians | 6.7 /100 | #236 | Tragic $44,552 |
| Immigrants | Ecuador | 5.9 /100 | #237 | Tragic $44,462 |
| Sudanese | 5.6 /100 | #238 | Tragic $44,419 |
| Senegalese | 5.3 /100 | #239 | Tragic $44,373 |
| Aleuts | 4.4 /100 | #240 | Tragic $44,241 |
| Samoans | 4.2 /100 | #241 | Tragic $44,206 |
| Immigrants | Venezuela | 4.0 /100 | #242 | Tragic $44,163 |
| Sub-Saharan Africans | 3.7 /100 | #243 | Tragic $44,118 |
| Immigrants | Nonimmigrants | 3.7 /100 | #244 | Tragic $44,117 |
| Immigrants | Burma/Myanmar | 3.2 /100 | #245 | Tragic $43,998 |
| Immigrants | West Indies | 3.1 /100 | #246 | Tragic $43,989 |
Demographics Similar to Hondurans by Median Earnings
In terms of median earnings, the demographic groups most similar to Hondurans are Yaqui ($40,647, a difference of 0.020%), Cuban ($40,619, a difference of 0.050%), Chickasaw ($40,672, a difference of 0.080%), Immigrants from Haiti ($40,550, a difference of 0.22%), and Immigrants from Guatemala ($40,851, a difference of 0.52%).
| Demographics | Rating | Rank | Median Earnings |
| Ute | 0.1 /100 | #300 | Tragic $41,051 |
| Immigrants | Latin America | 0.1 /100 | #301 | Tragic $41,049 |
| Shoshone | 0.0 /100 | #302 | Tragic $40,932 |
| Haitians | 0.0 /100 | #303 | Tragic $40,918 |
| Immigrants | Guatemala | 0.0 /100 | #304 | Tragic $40,851 |
| Chickasaw | 0.0 /100 | #305 | Tragic $40,672 |
| Yaqui | 0.0 /100 | #306 | Tragic $40,647 |
| Hondurans | 0.0 /100 | #307 | Tragic $40,638 |
| Cubans | 0.0 /100 | #308 | Tragic $40,619 |
| Immigrants | Haiti | 0.0 /100 | #309 | Tragic $40,550 |
| Apache | 0.0 /100 | #310 | Tragic $40,388 |
| Hispanics or Latinos | 0.0 /100 | #311 | Tragic $40,288 |
| Chippewa | 0.0 /100 | #312 | Tragic $40,287 |
| Choctaw | 0.0 /100 | #313 | Tragic $40,270 |
| Cheyenne | 0.0 /100 | #314 | Tragic $40,233 |