Senegalese vs Colombian Median Earnings
COMPARE
Senegalese
Colombian
Median Earnings
Median Earnings Comparison
Senegalese
Colombians
$44,373
MEDIAN EARNINGS
5.3/ 100
METRIC RATING
239th/ 347
METRIC RANK
$46,349
MEDIAN EARNINGS
47.1/ 100
METRIC RATING
178th/ 347
METRIC RANK
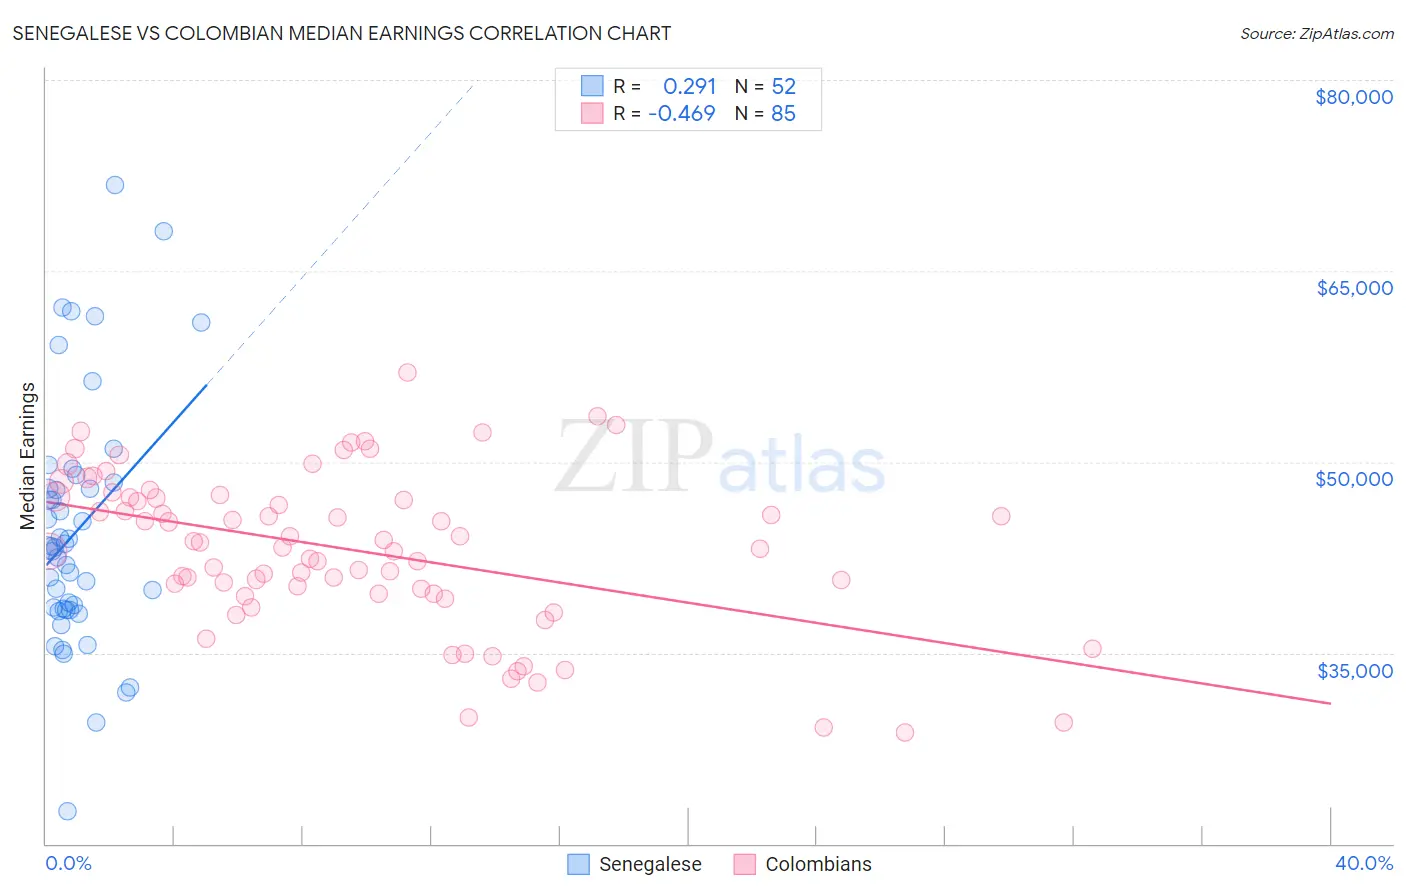
Senegalese vs Colombian Median Earnings Correlation Chart
The statistical analysis conducted on geographies consisting of 78,107,065 people shows a weak positive correlation between the proportion of Senegalese and median earnings in the United States with a correlation coefficient (R) of 0.291 and weighted average of $44,373. Similarly, the statistical analysis conducted on geographies consisting of 419,670,347 people shows a moderate negative correlation between the proportion of Colombians and median earnings in the United States with a correlation coefficient (R) of -0.469 and weighted average of $46,349, a difference of 4.4%.
Median Earnings Correlation Summary
| Measurement | Senegalese | Colombian |
| Minimum | $22,537 | $28,750 |
| Maximum | $71,772 | $57,032 |
| Range | $49,235 | $28,282 |
| Mean | $44,574 | $43,048 |
| Median | $43,248 | $43,271 |
| Interquartile 25% (IQ1) | $38,422 | $39,637 |
| Interquartile 75% (IQ3) | $48,145 | $47,254 |
| Interquartile Range (IQR) | $9,723 | $7,617 |
| Standard Deviation (Sample) | $9,701 | $6,158 |
| Standard Deviation (Population) | $9,608 | $6,121 |
Similar Demographics by Median Earnings
Demographics Similar to Senegalese by Median Earnings
In terms of median earnings, the demographic groups most similar to Senegalese are Sudanese ($44,419, a difference of 0.10%), Immigrants from Ecuador ($44,462, a difference of 0.20%), Aleut ($44,241, a difference of 0.30%), Samoan ($44,206, a difference of 0.38%), and British West Indian ($44,552, a difference of 0.40%).
| Demographics | Rating | Rank | Median Earnings |
| Delaware | 9.0 /100 | #232 | Tragic $44,783 |
| Immigrants | Sudan | 8.8 /100 | #233 | Tragic $44,767 |
| Cape Verdeans | 7.5 /100 | #234 | Tragic $44,640 |
| Venezuelans | 6.9 /100 | #235 | Tragic $44,580 |
| British West Indians | 6.7 /100 | #236 | Tragic $44,552 |
| Immigrants | Ecuador | 5.9 /100 | #237 | Tragic $44,462 |
| Sudanese | 5.6 /100 | #238 | Tragic $44,419 |
| Senegalese | 5.3 /100 | #239 | Tragic $44,373 |
| Aleuts | 4.4 /100 | #240 | Tragic $44,241 |
| Samoans | 4.2 /100 | #241 | Tragic $44,206 |
| Immigrants | Venezuela | 4.0 /100 | #242 | Tragic $44,163 |
| Sub-Saharan Africans | 3.7 /100 | #243 | Tragic $44,118 |
| Immigrants | Nonimmigrants | 3.7 /100 | #244 | Tragic $44,117 |
| Immigrants | Burma/Myanmar | 3.2 /100 | #245 | Tragic $43,998 |
| Immigrants | West Indies | 3.1 /100 | #246 | Tragic $43,989 |
Demographics Similar to Colombians by Median Earnings
In terms of median earnings, the demographic groups most similar to Colombians are English ($46,334, a difference of 0.030%), Puget Sound Salish ($46,333, a difference of 0.040%), Immigrants from Cameroon ($46,329, a difference of 0.040%), Belgian ($46,375, a difference of 0.060%), and Swiss ($46,315, a difference of 0.070%).
| Demographics | Rating | Rank | Median Earnings |
| Scottish | 51.1 /100 | #171 | Average $46,463 |
| Kenyans | 51.0 /100 | #172 | Average $46,462 |
| Ghanaians | 50.3 /100 | #173 | Average $46,440 |
| Scandinavians | 50.0 /100 | #174 | Average $46,433 |
| Basques | 48.8 /100 | #175 | Average $46,399 |
| Danes | 48.6 /100 | #176 | Average $46,392 |
| Belgians | 48.0 /100 | #177 | Average $46,375 |
| Colombians | 47.1 /100 | #178 | Average $46,349 |
| English | 46.5 /100 | #179 | Average $46,334 |
| Puget Sound Salish | 46.5 /100 | #180 | Average $46,333 |
| Immigrants | Cameroon | 46.4 /100 | #181 | Average $46,329 |
| Swiss | 45.9 /100 | #182 | Average $46,315 |
| French | 45.2 /100 | #183 | Average $46,296 |
| Immigrants | Kenya | 42.4 /100 | #184 | Average $46,214 |
| Uruguayans | 41.6 /100 | #185 | Average $46,190 |