Scotch-Irish vs Immigrants from Trinidad and Tobago 8th Grade
COMPARE
Scotch-Irish
Immigrants from Trinidad and Tobago
8th Grade
8th Grade Comparison
Scotch-Irish
Immigrants from Trinidad and Tobago
97.1%
8TH GRADE
100.0/ 100
METRIC RATING
27th/ 347
METRIC RANK
94.6%
8TH GRADE
0.1/ 100
METRIC RATING
279th/ 347
METRIC RANK
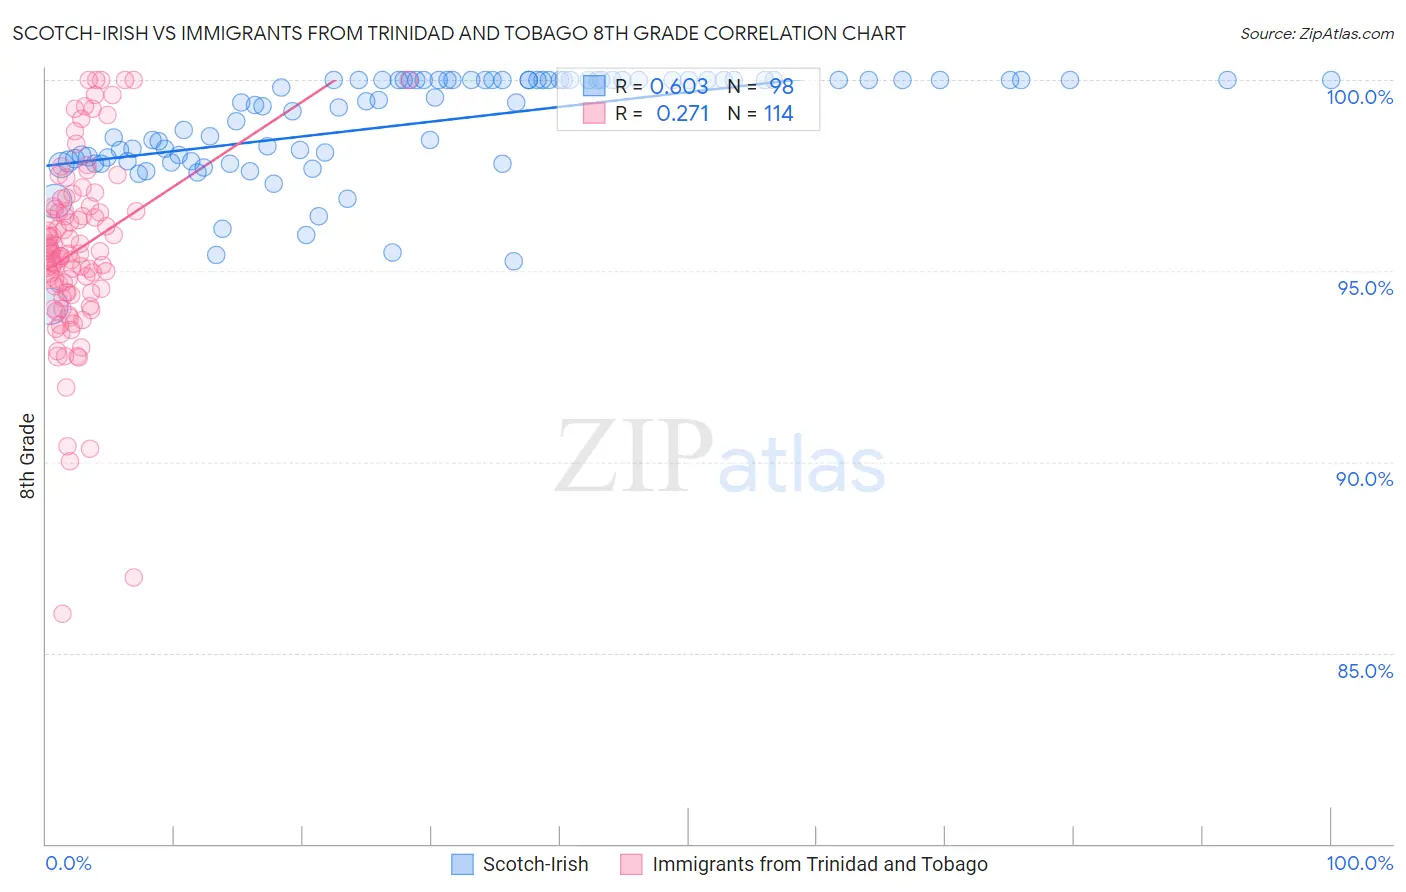
Scotch-Irish vs Immigrants from Trinidad and Tobago 8th Grade Correlation Chart
The statistical analysis conducted on geographies consisting of 548,777,407 people shows a significant positive correlation between the proportion of Scotch-Irish and percentage of population with at least 8th grade education in the United States with a correlation coefficient (R) of 0.603 and weighted average of 97.1%. Similarly, the statistical analysis conducted on geographies consisting of 223,526,834 people shows a weak positive correlation between the proportion of Immigrants from Trinidad and Tobago and percentage of population with at least 8th grade education in the United States with a correlation coefficient (R) of 0.271 and weighted average of 94.6%, a difference of 2.6%.
8th Grade Correlation Summary
| Measurement | Scotch-Irish | Immigrants from Trinidad and Tobago |
| Minimum | 94.1% | 86.0% |
| Maximum | 100.0% | 100.0% |
| Range | 5.9% | 14.0% |
| Mean | 98.9% | 95.5% |
| Median | 99.4% | 95.5% |
| Interquartile 25% (IQ1) | 97.9% | 94.4% |
| Interquartile 75% (IQ3) | 100.0% | 96.6% |
| Interquartile Range (IQR) | 2.1% | 2.2% |
| Standard Deviation (Sample) | 1.4% | 2.4% |
| Standard Deviation (Population) | 1.4% | 2.4% |
Similar Demographics by 8th Grade
Demographics Similar to Scotch-Irish by 8th Grade
In terms of 8th grade, the demographic groups most similar to Scotch-Irish are Italian (97.1%, a difference of 0.010%), European (97.1%, a difference of 0.010%), Czech (97.1%, a difference of 0.020%), French (97.1%, a difference of 0.020%), and Scandinavian (97.2%, a difference of 0.030%).
| Demographics | Rating | Rank | 8th Grade |
| Croatians | 100.0 /100 | #20 | Exceptional 97.2% |
| Danes | 100.0 /100 | #21 | Exceptional 97.2% |
| Welsh | 100.0 /100 | #22 | Exceptional 97.2% |
| French Canadians | 100.0 /100 | #23 | Exceptional 97.2% |
| Scandinavians | 100.0 /100 | #24 | Exceptional 97.2% |
| Czechs | 100.0 /100 | #25 | Exceptional 97.1% |
| French | 100.0 /100 | #26 | Exceptional 97.1% |
| Scotch-Irish | 100.0 /100 | #27 | Exceptional 97.1% |
| Italians | 100.0 /100 | #28 | Exceptional 97.1% |
| Europeans | 100.0 /100 | #29 | Exceptional 97.1% |
| Sioux | 100.0 /100 | #30 | Exceptional 97.1% |
| Chippewa | 100.0 /100 | #31 | Exceptional 97.1% |
| Yup'ik | 100.0 /100 | #32 | Exceptional 97.0% |
| Swiss | 100.0 /100 | #33 | Exceptional 97.0% |
| Luxembourgers | 100.0 /100 | #34 | Exceptional 97.0% |
Demographics Similar to Immigrants from Trinidad and Tobago by 8th Grade
In terms of 8th grade, the demographic groups most similar to Immigrants from Trinidad and Tobago are Barbadian (94.6%, a difference of 0.0%), Armenian (94.7%, a difference of 0.010%), Immigrants from Bolivia (94.6%, a difference of 0.010%), Taiwanese (94.7%, a difference of 0.040%), and Immigrants from Eritrea (94.6%, a difference of 0.050%).
| Demographics | Rating | Rank | 8th Grade |
| Immigrants | South America | 0.2 /100 | #272 | Tragic 94.8% |
| Immigrants | Western Africa | 0.2 /100 | #273 | Tragic 94.8% |
| Trinidadians and Tobagonians | 0.2 /100 | #274 | Tragic 94.7% |
| Immigrants | Colombia | 0.2 /100 | #275 | Tragic 94.7% |
| Peruvians | 0.1 /100 | #276 | Tragic 94.7% |
| Taiwanese | 0.1 /100 | #277 | Tragic 94.7% |
| Armenians | 0.1 /100 | #278 | Tragic 94.7% |
| Immigrants | Trinidad and Tobago | 0.1 /100 | #279 | Tragic 94.6% |
| Barbadians | 0.1 /100 | #280 | Tragic 94.6% |
| Immigrants | Bolivia | 0.1 /100 | #281 | Tragic 94.6% |
| Immigrants | Eritrea | 0.1 /100 | #282 | Tragic 94.6% |
| Immigrants | St. Vincent and the Grenadines | 0.1 /100 | #283 | Tragic 94.6% |
| Immigrants | Philippines | 0.1 /100 | #284 | Tragic 94.6% |
| Immigrants | Barbados | 0.0 /100 | #285 | Tragic 94.5% |
| Immigrants | Peru | 0.0 /100 | #286 | Tragic 94.5% |