Vietnamese vs Immigrants from Trinidad and Tobago Wage/Income Gap
COMPARE
Vietnamese
Immigrants from Trinidad and Tobago
Wage/Income Gap
Wage/Income Gap Comparison
Vietnamese
Immigrants from Trinidad and Tobago
21.0%
WAGE/INCOME GAP
100.0/ 100
METRIC RATING
31st/ 347
METRIC RANK
19.3%
WAGE/INCOME GAP
100.0/ 100
METRIC RATING
14th/ 347
METRIC RANK
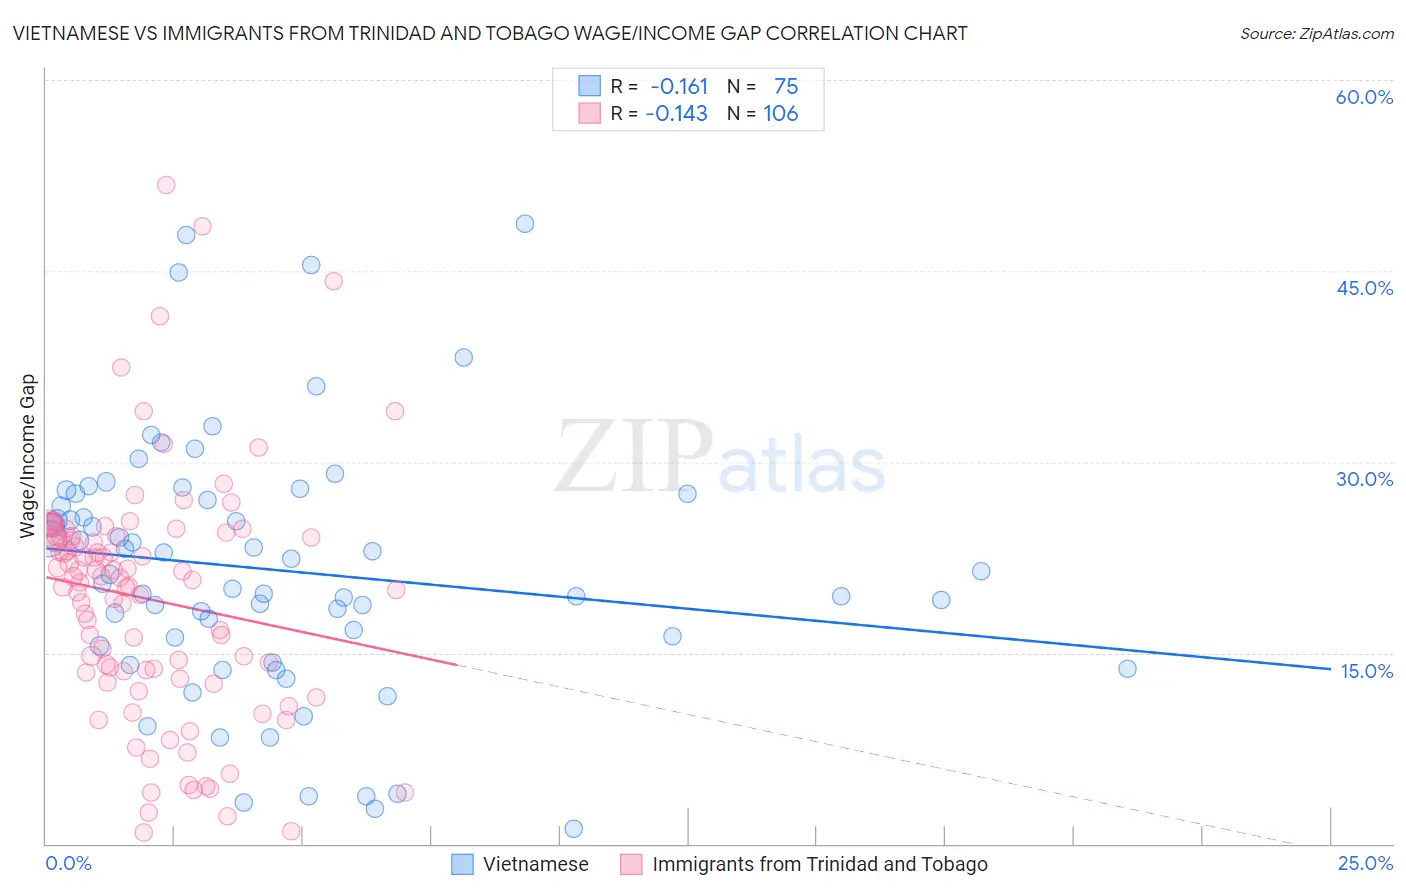
Vietnamese vs Immigrants from Trinidad and Tobago Wage/Income Gap Correlation Chart
The statistical analysis conducted on geographies consisting of 170,722,757 people shows a poor negative correlation between the proportion of Vietnamese and wage/income gap percentage in the United States with a correlation coefficient (R) of -0.161 and weighted average of 21.0%. Similarly, the statistical analysis conducted on geographies consisting of 223,459,768 people shows a poor negative correlation between the proportion of Immigrants from Trinidad and Tobago and wage/income gap percentage in the United States with a correlation coefficient (R) of -0.143 and weighted average of 19.3%, a difference of 8.6%.
Wage/Income Gap Correlation Summary
| Measurement | Vietnamese | Immigrants from Trinidad and Tobago |
| Minimum | 1.1% | 0.88% |
| Maximum | 48.7% | 51.8% |
| Range | 47.5% | 50.9% |
| Mean | 21.5% | 19.2% |
| Median | 21.2% | 20.6% |
| Interquartile 25% (IQ1) | 15.6% | 13.4% |
| Interquartile 75% (IQ3) | 27.5% | 24.1% |
| Interquartile Range (IQR) | 11.9% | 10.7% |
| Standard Deviation (Sample) | 10.1% | 9.5% |
| Standard Deviation (Population) | 10.0% | 9.5% |
Demographics Similar to Vietnamese and Immigrants from Trinidad and Tobago by Wage/Income Gap
In terms of wage/income gap, the demographic groups most similar to Vietnamese are Immigrants from Yemen (21.1%, a difference of 0.23%), Immigrants from Bangladesh (20.9%, a difference of 0.28%), Immigrants from Senegal (20.9%, a difference of 0.49%), Inupiat (20.8%, a difference of 1.1%), and Immigrants from Armenia (20.7%, a difference of 1.3%). Similarly, the demographic groups most similar to Immigrants from Trinidad and Tobago are Trinidadian and Tobagonian (19.3%, a difference of 0.050%), Immigrants from West Indies (19.2%, a difference of 0.53%), West Indian (19.6%, a difference of 1.2%), Jamaican (19.6%, a difference of 1.3%), and Haitian (19.7%, a difference of 2.1%).
| Demographics | Rating | Rank | Wage/Income Gap |
| Immigrants | West Indies | 100.0 /100 | #12 | Exceptional 19.2% |
| Trinidadians and Tobagonians | 100.0 /100 | #13 | Exceptional 19.3% |
| Immigrants | Trinidad and Tobago | 100.0 /100 | #14 | Exceptional 19.3% |
| West Indians | 100.0 /100 | #15 | Exceptional 19.6% |
| Jamaicans | 100.0 /100 | #16 | Exceptional 19.6% |
| Haitians | 100.0 /100 | #17 | Exceptional 19.7% |
| Hopi | 100.0 /100 | #18 | Exceptional 20.0% |
| Immigrants | Dominica | 100.0 /100 | #19 | Exceptional 20.0% |
| Bahamians | 100.0 /100 | #20 | Exceptional 20.2% |
| Immigrants | Caribbean | 100.0 /100 | #21 | Exceptional 20.4% |
| Immigrants | Liberia | 100.0 /100 | #22 | Exceptional 20.6% |
| Immigrants | Dominican Republic | 100.0 /100 | #23 | Exceptional 20.6% |
| Dominicans | 100.0 /100 | #24 | Exceptional 20.6% |
| Senegalese | 100.0 /100 | #25 | Exceptional 20.7% |
| Pueblo | 100.0 /100 | #26 | Exceptional 20.7% |
| Immigrants | Armenia | 100.0 /100 | #27 | Exceptional 20.7% |
| Inupiat | 100.0 /100 | #28 | Exceptional 20.8% |
| Immigrants | Senegal | 100.0 /100 | #29 | Exceptional 20.9% |
| Immigrants | Bangladesh | 100.0 /100 | #30 | Exceptional 20.9% |
| Vietnamese | 100.0 /100 | #31 | Exceptional 21.0% |
| Immigrants | Yemen | 100.0 /100 | #32 | Exceptional 21.1% |