Immigrants from Lithuania vs Immigrants from Trinidad and Tobago Wage/Income Gap
COMPARE
Immigrants from Lithuania
Immigrants from Trinidad and Tobago
Wage/Income Gap
Wage/Income Gap Comparison
Immigrants from Lithuania
Immigrants from Trinidad and Tobago
28.6%
WAGE/INCOME GAP
0.1/ 100
METRIC RATING
311th/ 347
METRIC RANK
19.3%
WAGE/INCOME GAP
100.0/ 100
METRIC RATING
14th/ 347
METRIC RANK
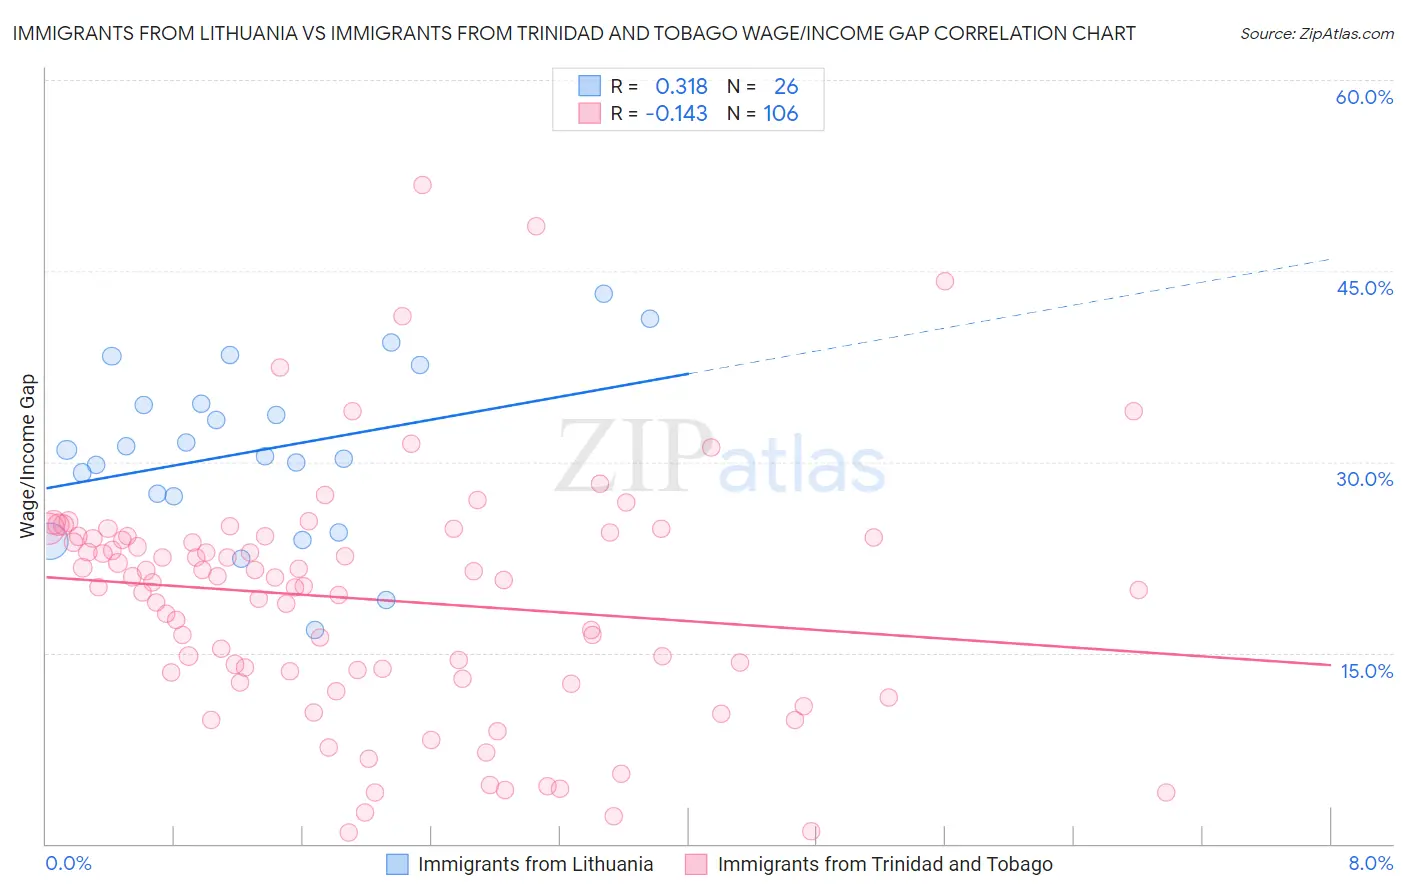
Immigrants from Lithuania vs Immigrants from Trinidad and Tobago Wage/Income Gap Correlation Chart
The statistical analysis conducted on geographies consisting of 117,698,624 people shows a mild positive correlation between the proportion of Immigrants from Lithuania and wage/income gap percentage in the United States with a correlation coefficient (R) of 0.318 and weighted average of 28.6%. Similarly, the statistical analysis conducted on geographies consisting of 223,459,768 people shows a poor negative correlation between the proportion of Immigrants from Trinidad and Tobago and wage/income gap percentage in the United States with a correlation coefficient (R) of -0.143 and weighted average of 19.3%, a difference of 48.0%.
Wage/Income Gap Correlation Summary
| Measurement | Immigrants from Lithuania | Immigrants from Trinidad and Tobago |
| Minimum | 16.8% | 0.88% |
| Maximum | 43.2% | 51.8% |
| Range | 26.5% | 50.9% |
| Mean | 30.9% | 19.2% |
| Median | 30.7% | 20.6% |
| Interquartile 25% (IQ1) | 27.3% | 13.4% |
| Interquartile 75% (IQ3) | 34.5% | 24.1% |
| Interquartile Range (IQR) | 7.3% | 10.7% |
| Standard Deviation (Sample) | 6.7% | 9.5% |
| Standard Deviation (Population) | 6.5% | 9.5% |
Similar Demographics by Wage/Income Gap
Demographics Similar to Immigrants from Lithuania by Wage/Income Gap
In terms of wage/income gap, the demographic groups most similar to Immigrants from Lithuania are Finnish (28.6%, a difference of 0.070%), Eastern European (28.6%, a difference of 0.13%), Macedonian (28.6%, a difference of 0.16%), Polish (28.5%, a difference of 0.25%), and French (28.7%, a difference of 0.26%).
| Demographics | Rating | Rank | Wage/Income Gap |
| Immigrants | Netherlands | 0.2 /100 | #304 | Tragic 28.5% |
| Immigrants | South Africa | 0.1 /100 | #305 | Tragic 28.5% |
| Whites/Caucasians | 0.1 /100 | #306 | Tragic 28.5% |
| Immigrants | Denmark | 0.1 /100 | #307 | Tragic 28.5% |
| Poles | 0.1 /100 | #308 | Tragic 28.5% |
| Macedonians | 0.1 /100 | #309 | Tragic 28.6% |
| Finns | 0.1 /100 | #310 | Tragic 28.6% |
| Immigrants | Lithuania | 0.1 /100 | #311 | Tragic 28.6% |
| Eastern Europeans | 0.1 /100 | #312 | Tragic 28.6% |
| French | 0.1 /100 | #313 | Tragic 28.7% |
| Immigrants | Scotland | 0.1 /100 | #314 | Tragic 28.7% |
| Maltese | 0.1 /100 | #315 | Tragic 28.7% |
| Lithuanians | 0.1 /100 | #316 | Tragic 28.7% |
| Belgians | 0.1 /100 | #317 | Tragic 28.8% |
| Basques | 0.1 /100 | #318 | Tragic 28.8% |
Demographics Similar to Immigrants from Trinidad and Tobago by Wage/Income Gap
In terms of wage/income gap, the demographic groups most similar to Immigrants from Trinidad and Tobago are Trinidadian and Tobagonian (19.3%, a difference of 0.050%), Immigrants from West Indies (19.2%, a difference of 0.53%), Immigrants from Haiti (19.2%, a difference of 0.64%), West Indian (19.6%, a difference of 1.2%), and Jamaican (19.6%, a difference of 1.3%).
| Demographics | Rating | Rank | Wage/Income Gap |
| Puerto Ricans | 100.0 /100 | #7 | Exceptional 18.7% |
| Immigrants | Jamaica | 100.0 /100 | #8 | Exceptional 18.8% |
| Barbadians | 100.0 /100 | #9 | Exceptional 19.0% |
| Crow | 100.0 /100 | #10 | Exceptional 19.1% |
| Immigrants | Haiti | 100.0 /100 | #11 | Exceptional 19.2% |
| Immigrants | West Indies | 100.0 /100 | #12 | Exceptional 19.2% |
| Trinidadians and Tobagonians | 100.0 /100 | #13 | Exceptional 19.3% |
| Immigrants | Trinidad and Tobago | 100.0 /100 | #14 | Exceptional 19.3% |
| West Indians | 100.0 /100 | #15 | Exceptional 19.6% |
| Jamaicans | 100.0 /100 | #16 | Exceptional 19.6% |
| Haitians | 100.0 /100 | #17 | Exceptional 19.7% |
| Hopi | 100.0 /100 | #18 | Exceptional 20.0% |
| Immigrants | Dominica | 100.0 /100 | #19 | Exceptional 20.0% |
| Bahamians | 100.0 /100 | #20 | Exceptional 20.2% |
| Immigrants | Caribbean | 100.0 /100 | #21 | Exceptional 20.4% |