Immigrants from Sweden vs Immigrants from Lithuania Median Family Income
COMPARE
Immigrants from Sweden
Immigrants from Lithuania
Median Family Income
Median Family Income Comparison
Immigrants from Sweden
Immigrants from Lithuania
$122,765
MEDIAN FAMILY INCOME
100.0/ 100
METRIC RATING
22nd/ 347
METRIC RANK
$118,053
MEDIAN FAMILY INCOME
100.0/ 100
METRIC RATING
40th/ 347
METRIC RANK
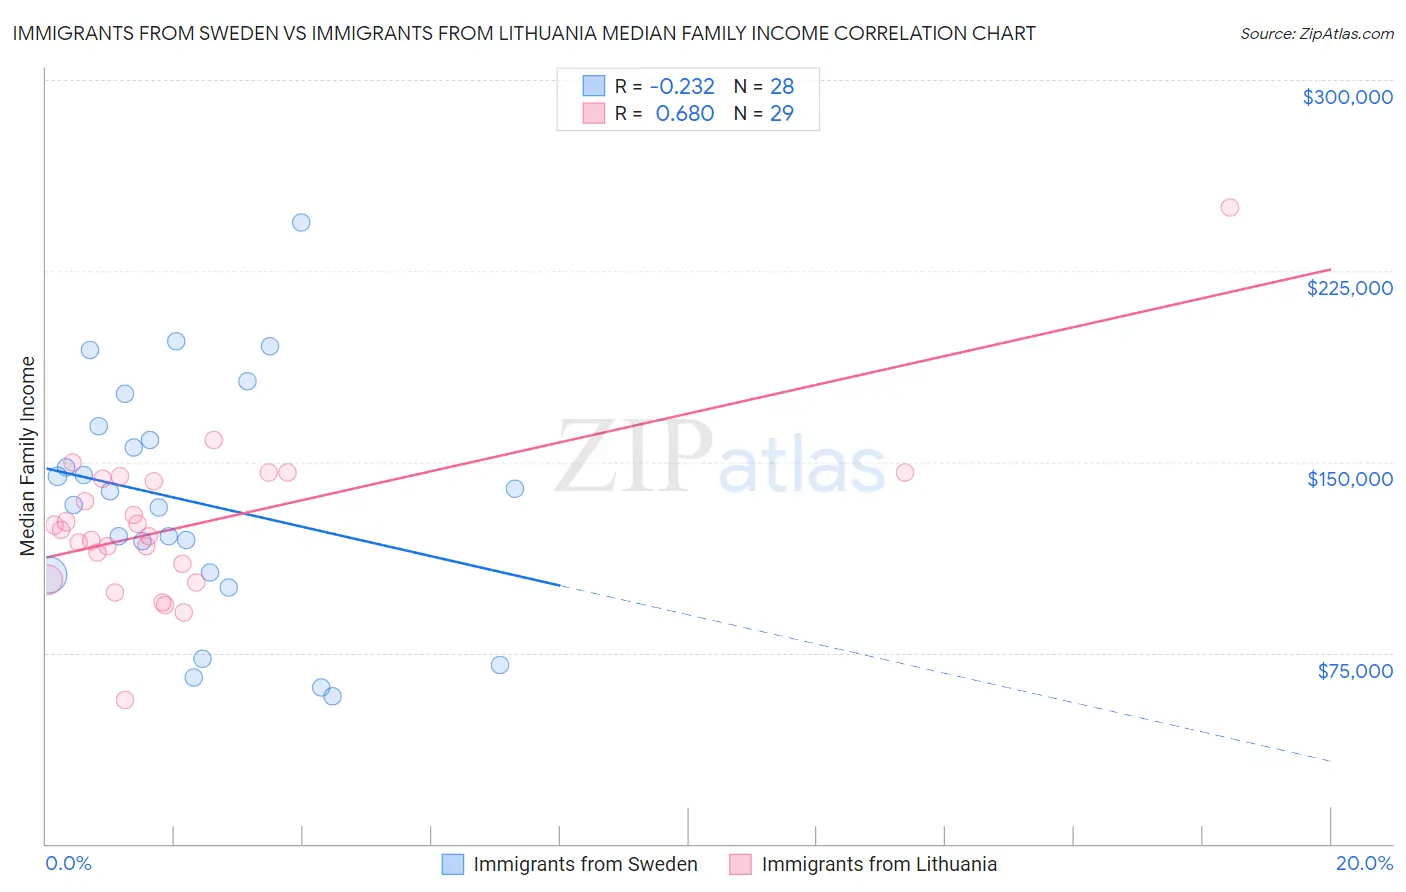
Immigrants from Sweden vs Immigrants from Lithuania Median Family Income Correlation Chart
The statistical analysis conducted on geographies consisting of 164,691,599 people shows a weak negative correlation between the proportion of Immigrants from Sweden and median family income in the United States with a correlation coefficient (R) of -0.232 and weighted average of $122,765. Similarly, the statistical analysis conducted on geographies consisting of 117,713,415 people shows a significant positive correlation between the proportion of Immigrants from Lithuania and median family income in the United States with a correlation coefficient (R) of 0.680 and weighted average of $118,053, a difference of 4.0%.
Median Family Income Correlation Summary
| Measurement | Immigrants from Sweden | Immigrants from Lithuania |
| Minimum | $57,930 | $56,363 |
| Maximum | $244,028 | $250,001 |
| Range | $186,098 | $193,638 |
| Mean | $134,549 | $125,785 |
| Median | $135,850 | $123,201 |
| Interquartile 25% (IQ1) | $105,866 | $106,762 |
| Interquartile 75% (IQ3) | $161,266 | $143,837 |
| Interquartile Range (IQR) | $55,400 | $37,076 |
| Standard Deviation (Sample) | $46,012 | $32,594 |
| Standard Deviation (Population) | $45,183 | $32,027 |
Demographics Similar to Immigrants from Sweden and Immigrants from Lithuania by Median Family Income
In terms of median family income, the demographic groups most similar to Immigrants from Sweden are Immigrants from Japan ($122,764, a difference of 0.0%), Immigrants from Korea ($122,800, a difference of 0.030%), Immigrants from Northern Europe ($121,840, a difference of 0.76%), Turkish ($121,202, a difference of 1.3%), and Immigrants from Switzerland ($120,726, a difference of 1.7%). Similarly, the demographic groups most similar to Immigrants from Lithuania are Estonian ($118,013, a difference of 0.030%), Immigrants from Asia ($118,291, a difference of 0.20%), Immigrants from Turkey ($118,325, a difference of 0.23%), Australian ($118,440, a difference of 0.33%), and Israeli ($118,577, a difference of 0.44%).
| Demographics | Rating | Rank | Median Family Income |
| Immigrants | Korea | 100.0 /100 | #21 | Exceptional $122,800 |
| Immigrants | Sweden | 100.0 /100 | #22 | Exceptional $122,765 |
| Immigrants | Japan | 100.0 /100 | #23 | Exceptional $122,764 |
| Immigrants | Northern Europe | 100.0 /100 | #24 | Exceptional $121,840 |
| Turks | 100.0 /100 | #25 | Exceptional $121,202 |
| Immigrants | Switzerland | 100.0 /100 | #26 | Exceptional $120,726 |
| Russians | 100.0 /100 | #27 | Exceptional $120,487 |
| Immigrants | Denmark | 100.0 /100 | #28 | Exceptional $120,445 |
| Latvians | 100.0 /100 | #29 | Exceptional $120,301 |
| Immigrants | Sri Lanka | 100.0 /100 | #30 | Exceptional $120,263 |
| Immigrants | France | 100.0 /100 | #31 | Exceptional $120,076 |
| Asians | 100.0 /100 | #32 | Exceptional $119,955 |
| Bhutanese | 100.0 /100 | #33 | Exceptional $119,800 |
| Bolivians | 100.0 /100 | #34 | Exceptional $119,479 |
| Soviet Union | 100.0 /100 | #35 | Exceptional $119,262 |
| Israelis | 100.0 /100 | #36 | Exceptional $118,577 |
| Australians | 100.0 /100 | #37 | Exceptional $118,440 |
| Immigrants | Turkey | 100.0 /100 | #38 | Exceptional $118,325 |
| Immigrants | Asia | 100.0 /100 | #39 | Exceptional $118,291 |
| Immigrants | Lithuania | 100.0 /100 | #40 | Exceptional $118,053 |
| Estonians | 100.0 /100 | #41 | Exceptional $118,013 |