Sudanese vs Immigrants from Lithuania Median Family Income
COMPARE
Sudanese
Immigrants from Lithuania
Median Family Income
Median Family Income Comparison
Sudanese
Immigrants from Lithuania
$96,783
MEDIAN FAMILY INCOME
4.7/ 100
METRIC RATING
220th/ 347
METRIC RANK
$118,053
MEDIAN FAMILY INCOME
100.0/ 100
METRIC RATING
40th/ 347
METRIC RANK
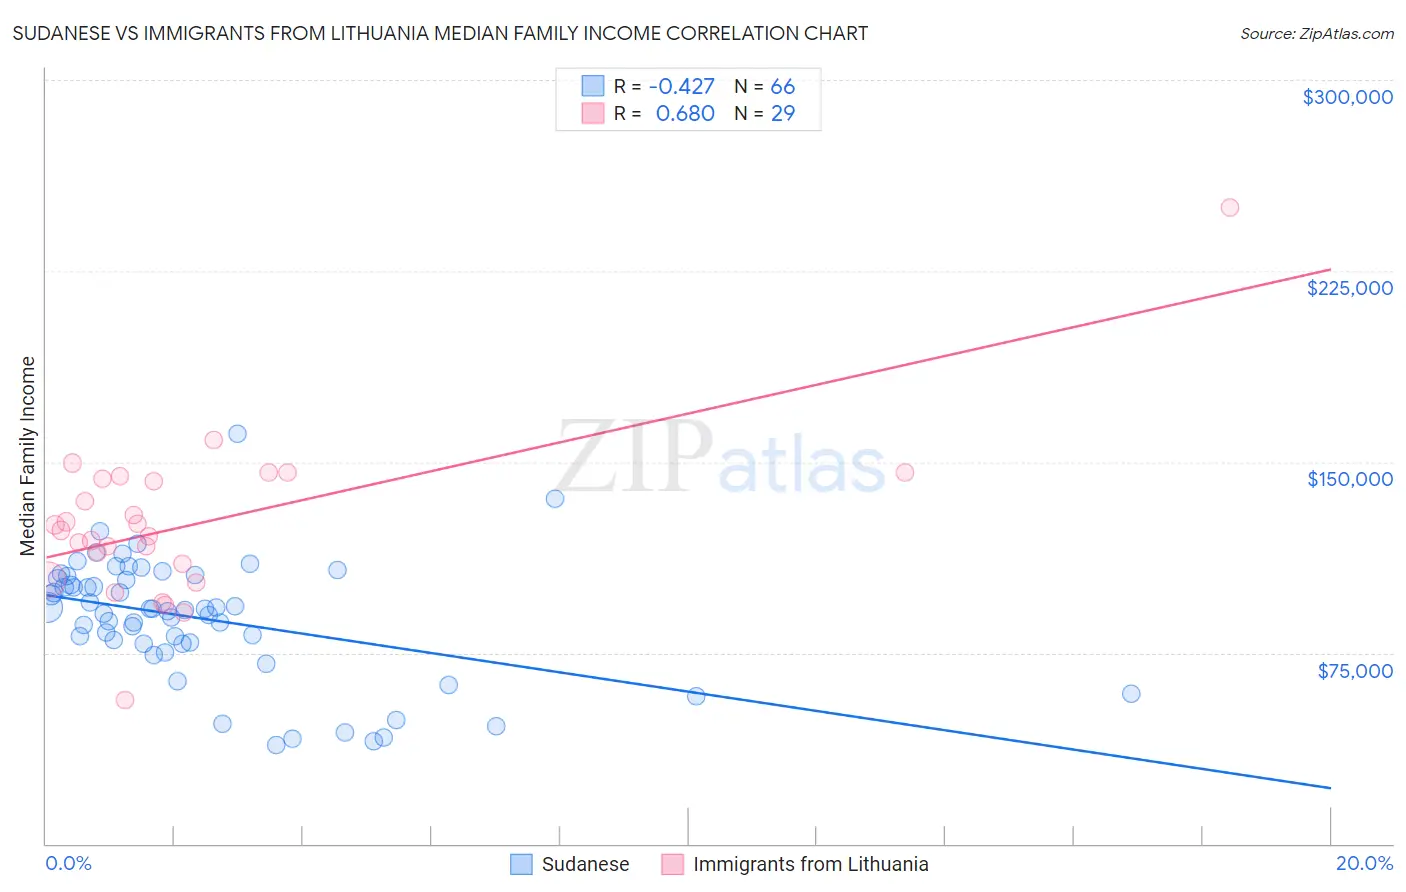
Sudanese vs Immigrants from Lithuania Median Family Income Correlation Chart
The statistical analysis conducted on geographies consisting of 110,081,716 people shows a moderate negative correlation between the proportion of Sudanese and median family income in the United States with a correlation coefficient (R) of -0.427 and weighted average of $96,783. Similarly, the statistical analysis conducted on geographies consisting of 117,713,415 people shows a significant positive correlation between the proportion of Immigrants from Lithuania and median family income in the United States with a correlation coefficient (R) of 0.680 and weighted average of $118,053, a difference of 22.0%.
Median Family Income Correlation Summary
| Measurement | Sudanese | Immigrants from Lithuania |
| Minimum | $38,840 | $56,363 |
| Maximum | $160,922 | $250,001 |
| Range | $122,082 | $193,638 |
| Mean | $88,541 | $125,785 |
| Median | $92,056 | $123,201 |
| Interquartile 25% (IQ1) | $78,776 | $106,762 |
| Interquartile 75% (IQ3) | $104,200 | $143,837 |
| Interquartile Range (IQR) | $25,424 | $37,076 |
| Standard Deviation (Sample) | $23,841 | $32,594 |
| Standard Deviation (Population) | $23,660 | $32,027 |
Similar Demographics by Median Family Income
Demographics Similar to Sudanese by Median Family Income
In terms of median family income, the demographic groups most similar to Sudanese are Delaware ($96,958, a difference of 0.18%), Immigrants from Ghana ($96,544, a difference of 0.25%), Immigrants from Nigeria ($96,439, a difference of 0.36%), Immigrants from Cambodia ($97,222, a difference of 0.45%), and Japanese ($97,288, a difference of 0.52%).
| Demographics | Rating | Rank | Median Family Income |
| Immigrants | Armenia | 7.0 /100 | #213 | Tragic $97,605 |
| Bermudans | 6.9 /100 | #214 | Tragic $97,577 |
| Nigerians | 6.7 /100 | #215 | Tragic $97,522 |
| Immigrants | Bosnia and Herzegovina | 6.4 /100 | #216 | Tragic $97,432 |
| Japanese | 6.0 /100 | #217 | Tragic $97,288 |
| Immigrants | Cambodia | 5.8 /100 | #218 | Tragic $97,222 |
| Delaware | 5.1 /100 | #219 | Tragic $96,958 |
| Sudanese | 4.7 /100 | #220 | Tragic $96,783 |
| Immigrants | Ghana | 4.2 /100 | #221 | Tragic $96,544 |
| Immigrants | Nigeria | 4.0 /100 | #222 | Tragic $96,439 |
| Venezuelans | 3.7 /100 | #223 | Tragic $96,281 |
| Immigrants | Nonimmigrants | 3.6 /100 | #224 | Tragic $96,231 |
| Vietnamese | 3.4 /100 | #225 | Tragic $96,123 |
| Immigrants | Panama | 2.7 /100 | #226 | Tragic $95,647 |
| Alaska Natives | 2.6 /100 | #227 | Tragic $95,573 |
Demographics Similar to Immigrants from Lithuania by Median Family Income
In terms of median family income, the demographic groups most similar to Immigrants from Lithuania are Estonian ($118,013, a difference of 0.030%), Immigrants from Bolivia ($117,912, a difference of 0.12%), Immigrants from Asia ($118,291, a difference of 0.20%), Bulgarian ($117,818, a difference of 0.20%), and Immigrants from Turkey ($118,325, a difference of 0.23%).
| Demographics | Rating | Rank | Median Family Income |
| Bhutanese | 100.0 /100 | #33 | Exceptional $119,800 |
| Bolivians | 100.0 /100 | #34 | Exceptional $119,479 |
| Soviet Union | 100.0 /100 | #35 | Exceptional $119,262 |
| Israelis | 100.0 /100 | #36 | Exceptional $118,577 |
| Australians | 100.0 /100 | #37 | Exceptional $118,440 |
| Immigrants | Turkey | 100.0 /100 | #38 | Exceptional $118,325 |
| Immigrants | Asia | 100.0 /100 | #39 | Exceptional $118,291 |
| Immigrants | Lithuania | 100.0 /100 | #40 | Exceptional $118,053 |
| Estonians | 100.0 /100 | #41 | Exceptional $118,013 |
| Immigrants | Bolivia | 100.0 /100 | #42 | Exceptional $117,912 |
| Bulgarians | 100.0 /100 | #43 | Exceptional $117,818 |
| Cambodians | 100.0 /100 | #44 | Exceptional $117,780 |
| Immigrants | Greece | 99.9 /100 | #45 | Exceptional $117,344 |
| Immigrants | Russia | 99.9 /100 | #46 | Exceptional $116,942 |
| Immigrants | Austria | 99.9 /100 | #47 | Exceptional $116,830 |