Scotch-Irish vs Japanese Median Earnings
COMPARE
Scotch-Irish
Japanese
Median Earnings
Median Earnings Comparison
Scotch-Irish
Japanese
$44,924
MEDIAN EARNINGS
10.7/ 100
METRIC RATING
229th/ 347
METRIC RANK
$44,825
MEDIAN EARNINGS
9.5/ 100
METRIC RATING
231st/ 347
METRIC RANK
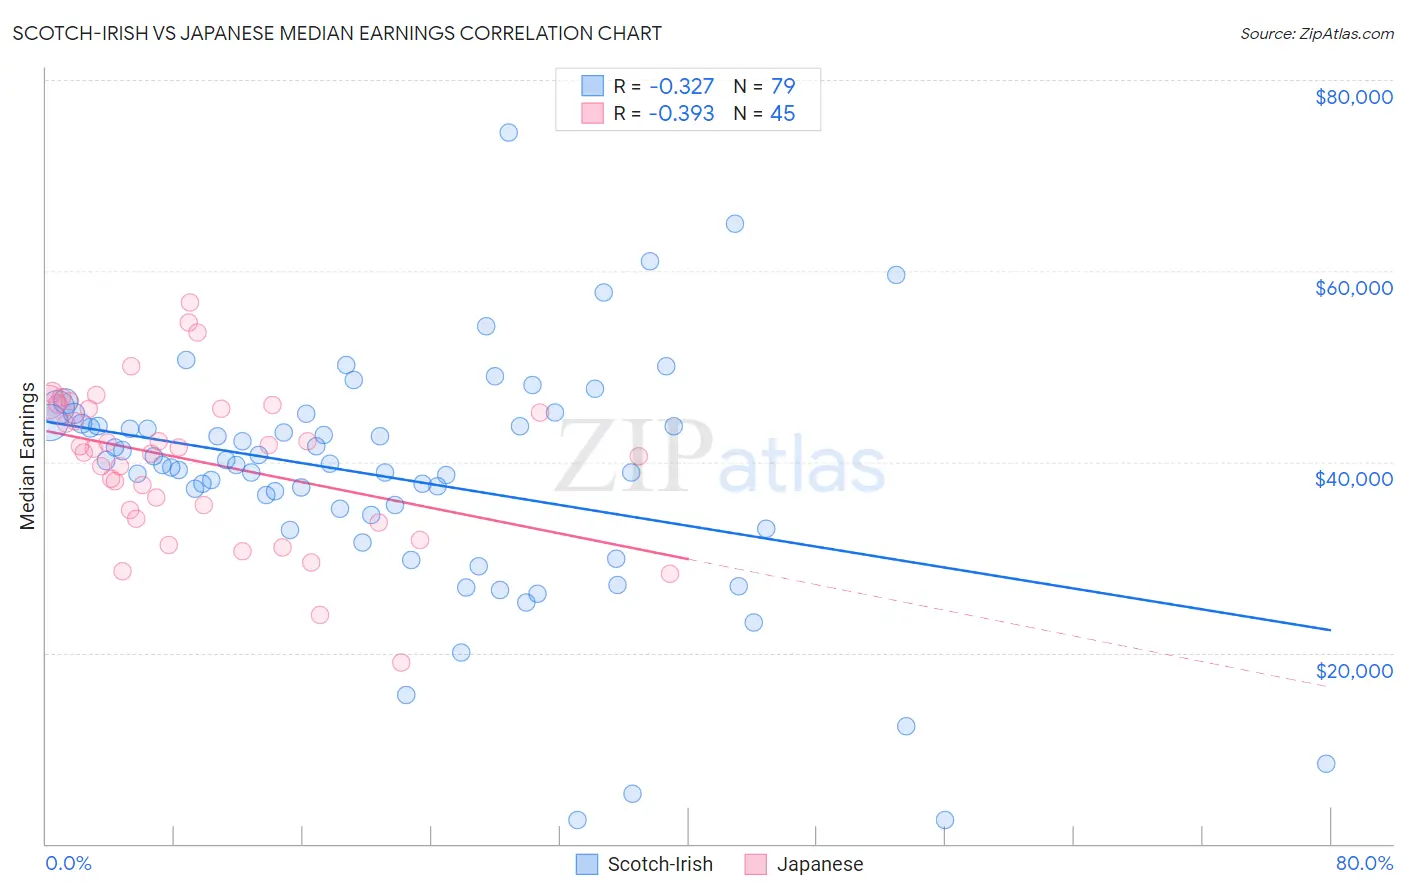
Scotch-Irish vs Japanese Median Earnings Correlation Chart
The statistical analysis conducted on geographies consisting of 548,498,961 people shows a mild negative correlation between the proportion of Scotch-Irish and median earnings in the United States with a correlation coefficient (R) of -0.327 and weighted average of $44,924. Similarly, the statistical analysis conducted on geographies consisting of 249,187,165 people shows a mild negative correlation between the proportion of Japanese and median earnings in the United States with a correlation coefficient (R) of -0.393 and weighted average of $44,825, a difference of 0.22%.
Median Earnings Correlation Summary
| Measurement | Scotch-Irish | Japanese |
| Minimum | $2,499 | $19,004 |
| Maximum | $74,508 | $56,680 |
| Range | $72,009 | $37,676 |
| Mean | $38,268 | $40,035 |
| Median | $39,708 | $41,417 |
| Interquartile 25% (IQ1) | $32,986 | $34,525 |
| Interquartile 75% (IQ3) | $43,991 | $45,796 |
| Interquartile Range (IQR) | $11,005 | $11,271 |
| Standard Deviation (Sample) | $12,720 | $7,916 |
| Standard Deviation (Population) | $12,639 | $7,827 |
Demographics Similar to Scotch-Irish and Japanese by Median Earnings
In terms of median earnings, the demographic groups most similar to Scotch-Irish are Immigrants from Western Africa ($44,893, a difference of 0.070%), Immigrants from Iraq ($44,988, a difference of 0.14%), Native Hawaiian ($45,027, a difference of 0.23%), Immigrants from Nigeria ($45,030, a difference of 0.24%), and Delaware ($44,783, a difference of 0.32%). Similarly, the demographic groups most similar to Japanese are Delaware ($44,783, a difference of 0.090%), Immigrants from Sudan ($44,767, a difference of 0.13%), Immigrants from Western Africa ($44,893, a difference of 0.15%), Immigrants from Iraq ($44,988, a difference of 0.37%), and Cape Verdean ($44,640, a difference of 0.41%).
| Demographics | Rating | Rank | Median Earnings |
| Ecuadorians | 15.3 /100 | #220 | Poor $45,214 |
| Immigrants | Guyana | 15.1 /100 | #221 | Poor $45,204 |
| Immigrants | Panama | 15.0 /100 | #222 | Poor $45,198 |
| Whites/Caucasians | 15.0 /100 | #223 | Poor $45,197 |
| West Indians | 13.9 /100 | #224 | Poor $45,132 |
| Immigrants | Cambodia | 13.2 /100 | #225 | Poor $45,090 |
| Immigrants | Nigeria | 12.2 /100 | #226 | Poor $45,030 |
| Native Hawaiians | 12.2 /100 | #227 | Poor $45,027 |
| Immigrants | Iraq | 11.6 /100 | #228 | Poor $44,988 |
| Scotch-Irish | 10.7 /100 | #229 | Poor $44,924 |
| Immigrants | Western Africa | 10.3 /100 | #230 | Poor $44,893 |
| Japanese | 9.5 /100 | #231 | Tragic $44,825 |
| Delaware | 9.0 /100 | #232 | Tragic $44,783 |
| Immigrants | Sudan | 8.8 /100 | #233 | Tragic $44,767 |
| Cape Verdeans | 7.5 /100 | #234 | Tragic $44,640 |
| Venezuelans | 6.9 /100 | #235 | Tragic $44,580 |
| British West Indians | 6.7 /100 | #236 | Tragic $44,552 |
| Immigrants | Ecuador | 5.9 /100 | #237 | Tragic $44,462 |
| Sudanese | 5.6 /100 | #238 | Tragic $44,419 |
| Senegalese | 5.3 /100 | #239 | Tragic $44,373 |
| Aleuts | 4.4 /100 | #240 | Tragic $44,241 |