Scotch-Irish vs Greek Median Earnings
COMPARE
Scotch-Irish
Greek
Median Earnings
Median Earnings Comparison
Scotch-Irish
Greeks
$44,924
MEDIAN EARNINGS
10.7/ 100
METRIC RATING
229th/ 347
METRIC RANK
$51,164
MEDIAN EARNINGS
99.9/ 100
METRIC RATING
65th/ 347
METRIC RANK
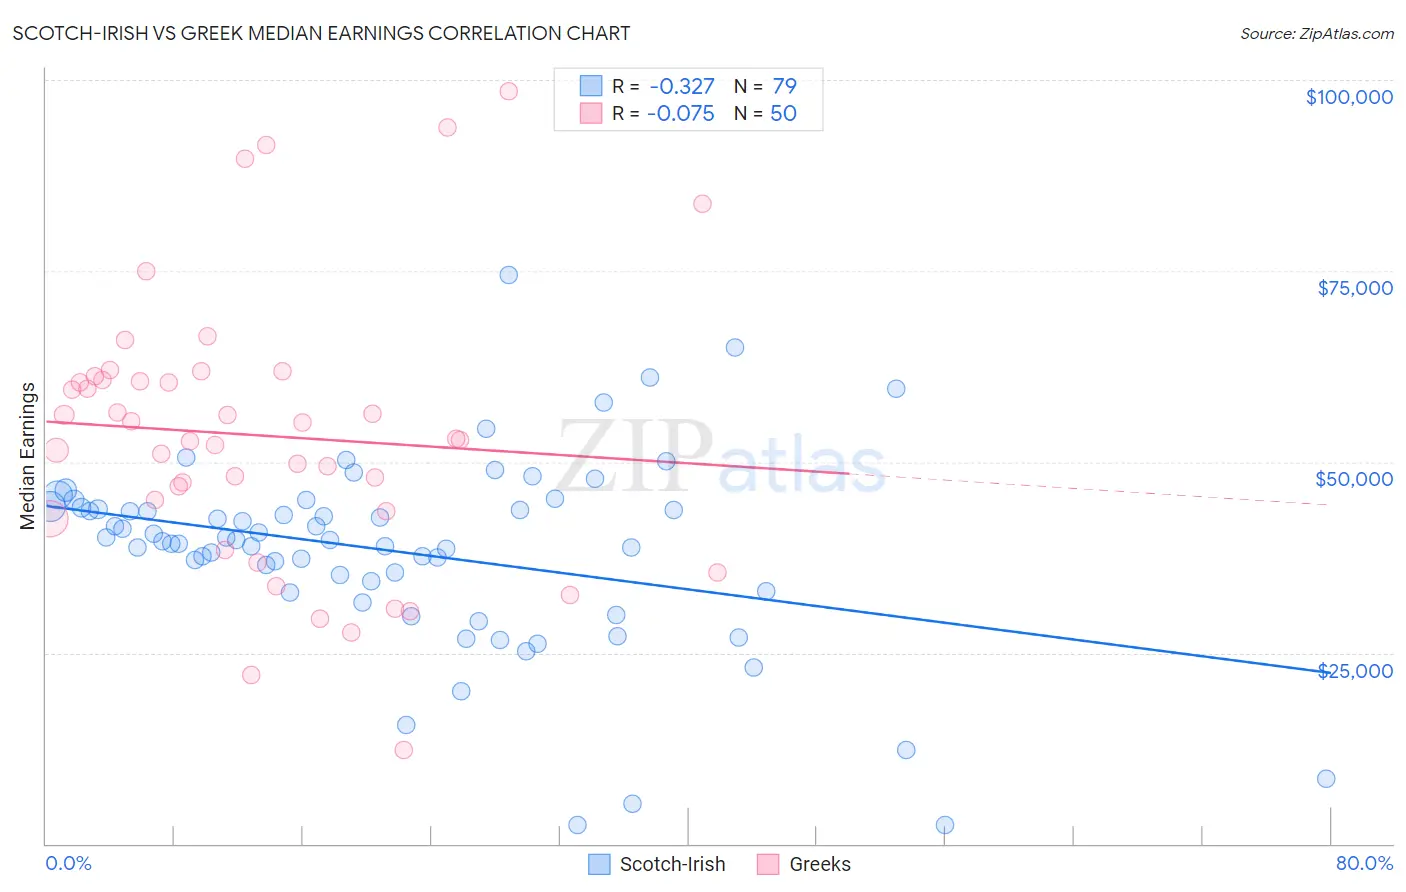
Scotch-Irish vs Greek Median Earnings Correlation Chart
The statistical analysis conducted on geographies consisting of 548,498,961 people shows a mild negative correlation between the proportion of Scotch-Irish and median earnings in the United States with a correlation coefficient (R) of -0.327 and weighted average of $44,924. Similarly, the statistical analysis conducted on geographies consisting of 482,719,843 people shows a slight negative correlation between the proportion of Greeks and median earnings in the United States with a correlation coefficient (R) of -0.075 and weighted average of $51,164, a difference of 13.9%.
Median Earnings Correlation Summary
| Measurement | Scotch-Irish | Greek |
| Minimum | $2,499 | $12,321 |
| Maximum | $74,508 | $98,462 |
| Range | $72,009 | $86,141 |
| Mean | $38,268 | $53,439 |
| Median | $39,708 | $52,981 |
| Interquartile 25% (IQ1) | $32,986 | $43,544 |
| Interquartile 75% (IQ3) | $43,991 | $60,703 |
| Interquartile Range (IQR) | $11,005 | $17,159 |
| Standard Deviation (Sample) | $12,720 | $17,942 |
| Standard Deviation (Population) | $12,639 | $17,762 |
Similar Demographics by Median Earnings
Demographics Similar to Scotch-Irish by Median Earnings
In terms of median earnings, the demographic groups most similar to Scotch-Irish are Immigrants from Western Africa ($44,893, a difference of 0.070%), Immigrants from Iraq ($44,988, a difference of 0.14%), Japanese ($44,825, a difference of 0.22%), Native Hawaiian ($45,027, a difference of 0.23%), and Immigrants from Nigeria ($45,030, a difference of 0.24%).
| Demographics | Rating | Rank | Median Earnings |
| Immigrants | Panama | 15.0 /100 | #222 | Poor $45,198 |
| Whites/Caucasians | 15.0 /100 | #223 | Poor $45,197 |
| West Indians | 13.9 /100 | #224 | Poor $45,132 |
| Immigrants | Cambodia | 13.2 /100 | #225 | Poor $45,090 |
| Immigrants | Nigeria | 12.2 /100 | #226 | Poor $45,030 |
| Native Hawaiians | 12.2 /100 | #227 | Poor $45,027 |
| Immigrants | Iraq | 11.6 /100 | #228 | Poor $44,988 |
| Scotch-Irish | 10.7 /100 | #229 | Poor $44,924 |
| Immigrants | Western Africa | 10.3 /100 | #230 | Poor $44,893 |
| Japanese | 9.5 /100 | #231 | Tragic $44,825 |
| Delaware | 9.0 /100 | #232 | Tragic $44,783 |
| Immigrants | Sudan | 8.8 /100 | #233 | Tragic $44,767 |
| Cape Verdeans | 7.5 /100 | #234 | Tragic $44,640 |
| Venezuelans | 6.9 /100 | #235 | Tragic $44,580 |
| British West Indians | 6.7 /100 | #236 | Tragic $44,552 |
Demographics Similar to Greeks by Median Earnings
In terms of median earnings, the demographic groups most similar to Greeks are Afghan ($51,112, a difference of 0.10%), Immigrants from Spain ($51,092, a difference of 0.14%), New Zealander ($51,246, a difference of 0.16%), Paraguayan ($51,068, a difference of 0.19%), and Mongolian ($51,038, a difference of 0.25%).
| Demographics | Rating | Rank | Median Earnings |
| Immigrants | Bolivia | 99.9 /100 | #58 | Exceptional $51,605 |
| Immigrants | Croatia | 99.9 /100 | #59 | Exceptional $51,581 |
| Immigrants | Serbia | 99.9 /100 | #60 | Exceptional $51,557 |
| Immigrants | Latvia | 99.9 /100 | #61 | Exceptional $51,555 |
| Immigrants | Romania | 99.9 /100 | #62 | Exceptional $51,337 |
| Immigrants | Bulgaria | 99.9 /100 | #63 | Exceptional $51,318 |
| New Zealanders | 99.9 /100 | #64 | Exceptional $51,246 |
| Greeks | 99.9 /100 | #65 | Exceptional $51,164 |
| Afghans | 99.9 /100 | #66 | Exceptional $51,112 |
| Immigrants | Spain | 99.9 /100 | #67 | Exceptional $51,092 |
| Paraguayans | 99.9 /100 | #68 | Exceptional $51,068 |
| Mongolians | 99.8 /100 | #69 | Exceptional $51,038 |
| Lithuanians | 99.8 /100 | #70 | Exceptional $50,991 |
| Immigrants | Ukraine | 99.8 /100 | #71 | Exceptional $50,984 |
| Immigrants | Egypt | 99.8 /100 | #72 | Exceptional $50,901 |