Scotch-Irish vs Immigrants from Iran College, 1 year or more
COMPARE
Scotch-Irish
Immigrants from Iran
College, 1 year or more
College, 1 year or more Comparison
Scotch-Irish
Immigrants from Iran
58.9%
COLLEGE, 1 YEAR OR MORE
34.7/ 100
METRIC RATING
186th/ 347
METRIC RANK
69.5%
COLLEGE, 1 YEAR OR MORE
100.0/ 100
METRIC RATING
6th/ 347
METRIC RANK
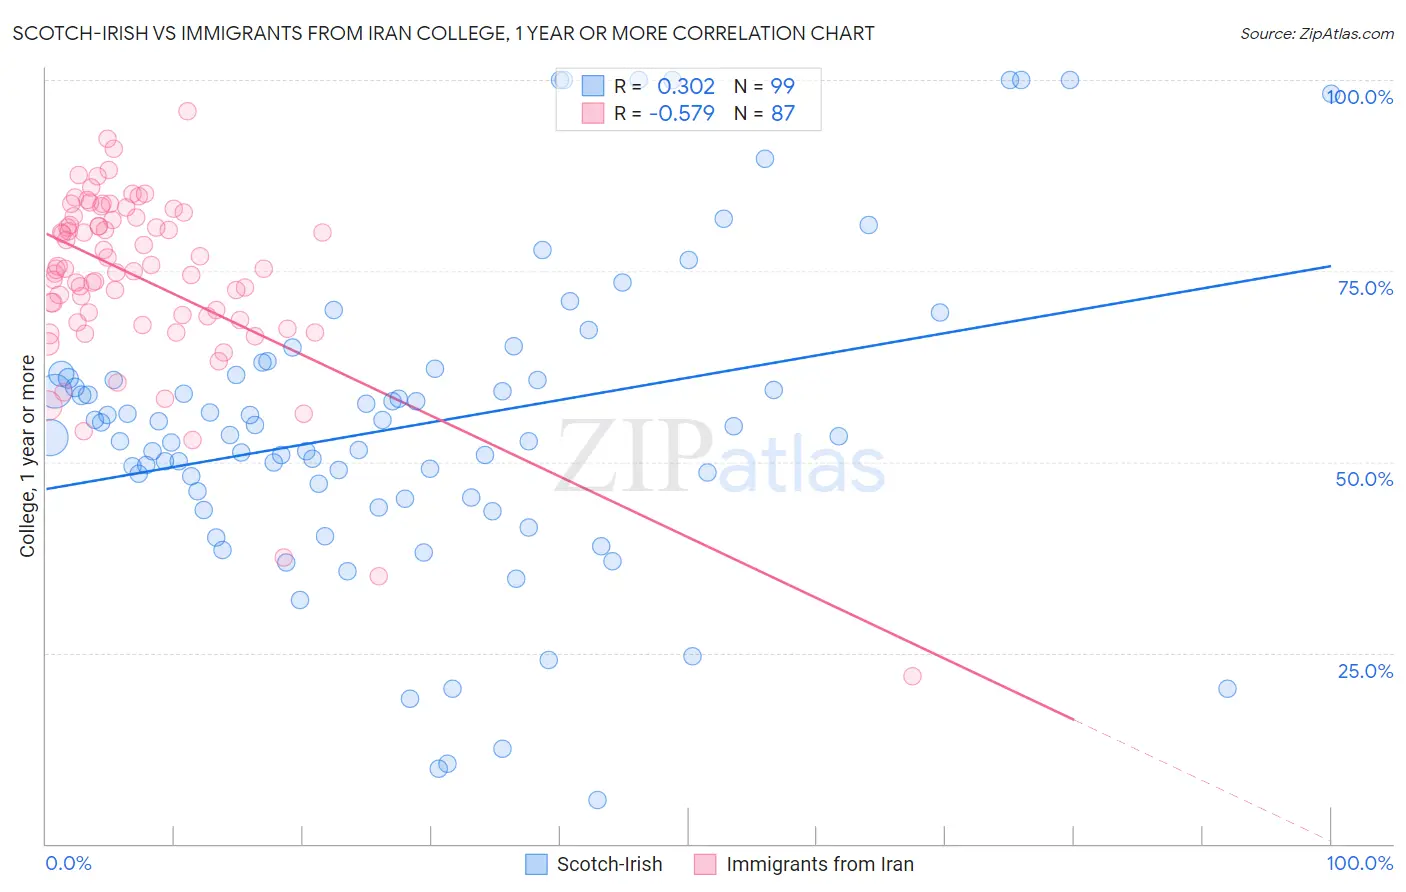
Scotch-Irish vs Immigrants from Iran College, 1 year or more Correlation Chart
The statistical analysis conducted on geographies consisting of 548,772,919 people shows a mild positive correlation between the proportion of Scotch-Irish and percentage of population with at least college, 1 year or more education in the United States with a correlation coefficient (R) of 0.302 and weighted average of 58.9%. Similarly, the statistical analysis conducted on geographies consisting of 279,905,207 people shows a substantial negative correlation between the proportion of Immigrants from Iran and percentage of population with at least college, 1 year or more education in the United States with a correlation coefficient (R) of -0.579 and weighted average of 69.5%, a difference of 18.0%.
College, 1 year or more Correlation Summary
| Measurement | Scotch-Irish | Immigrants from Iran |
| Minimum | 5.7% | 22.0% |
| Maximum | 100.0% | 96.0% |
| Range | 94.3% | 74.0% |
| Mean | 54.8% | 74.0% |
| Median | 53.5% | 75.3% |
| Interquartile 25% (IQ1) | 45.3% | 68.5% |
| Interquartile 75% (IQ3) | 61.3% | 82.0% |
| Interquartile Range (IQR) | 16.0% | 13.4% |
| Standard Deviation (Sample) | 20.2% | 12.0% |
| Standard Deviation (Population) | 20.1% | 11.9% |
Similar Demographics by College, 1 year or more
Demographics Similar to Scotch-Irish by College, 1 year or more
In terms of college, 1 year or more, the demographic groups most similar to Scotch-Irish are German (58.9%, a difference of 0.0%), French (58.9%, a difference of 0.020%), South American (59.0%, a difference of 0.070%), Uruguayan (58.8%, a difference of 0.18%), and Spaniard (59.0%, a difference of 0.21%).
| Demographics | Rating | Rank | College, 1 year or more |
| Bermudans | 46.6 /100 | #179 | Average 59.3% |
| Yugoslavians | 44.1 /100 | #180 | Average 59.2% |
| Swiss | 43.4 /100 | #181 | Average 59.2% |
| Immigrants | Bosnia and Herzegovina | 42.8 /100 | #182 | Average 59.2% |
| German Russians | 39.3 /100 | #183 | Fair 59.1% |
| Spaniards | 38.3 /100 | #184 | Fair 59.0% |
| South Americans | 35.9 /100 | #185 | Fair 59.0% |
| Scotch-Irish | 34.7 /100 | #186 | Fair 58.9% |
| Germans | 34.7 /100 | #187 | Fair 58.9% |
| French | 34.4 /100 | #188 | Fair 58.9% |
| Uruguayans | 31.8 /100 | #189 | Fair 58.8% |
| Immigrants | Cameroon | 31.2 /100 | #190 | Fair 58.8% |
| Immigrants | Philippines | 29.2 /100 | #191 | Fair 58.7% |
| Colombians | 27.6 /100 | #192 | Fair 58.7% |
| Peruvians | 27.5 /100 | #193 | Fair 58.6% |
Demographics Similar to Immigrants from Iran by College, 1 year or more
In terms of college, 1 year or more, the demographic groups most similar to Immigrants from Iran are Immigrants from Taiwan (69.6%, a difference of 0.20%), Immigrants from India (69.6%, a difference of 0.20%), Iranian (70.0%, a difference of 0.70%), Okinawan (69.0%, a difference of 0.77%), and Immigrants from Singapore (70.1%, a difference of 0.92%).
| Demographics | Rating | Rank | College, 1 year or more |
| Filipinos | 100.0 /100 | #1 | Exceptional 71.0% |
| Immigrants | Singapore | 100.0 /100 | #2 | Exceptional 70.1% |
| Iranians | 100.0 /100 | #3 | Exceptional 70.0% |
| Immigrants | Taiwan | 100.0 /100 | #4 | Exceptional 69.6% |
| Immigrants | India | 100.0 /100 | #5 | Exceptional 69.6% |
| Immigrants | Iran | 100.0 /100 | #6 | Exceptional 69.5% |
| Okinawans | 100.0 /100 | #7 | Exceptional 69.0% |
| Thais | 100.0 /100 | #8 | Exceptional 68.6% |
| Immigrants | Israel | 100.0 /100 | #9 | Exceptional 67.8% |
| Immigrants | Australia | 100.0 /100 | #10 | Exceptional 67.7% |
| Immigrants | South Central Asia | 100.0 /100 | #11 | Exceptional 67.1% |
| Cypriots | 100.0 /100 | #12 | Exceptional 67.0% |
| Immigrants | Sweden | 100.0 /100 | #13 | Exceptional 66.8% |
| Burmese | 100.0 /100 | #14 | Exceptional 66.7% |
| Cambodians | 100.0 /100 | #15 | Exceptional 66.7% |