Immigrants from the Azores vs Immigrants from Ghana Median Family Income
COMPARE
Immigrants from the Azores
Immigrants from Ghana
Median Family Income
Median Family Income Comparison
Immigrants from the Azores
Immigrants from Ghana
$95,402
MEDIAN FAMILY INCOME
2.4/ 100
METRIC RATING
228th/ 347
METRIC RANK
$96,544
MEDIAN FAMILY INCOME
4.2/ 100
METRIC RATING
221st/ 347
METRIC RANK
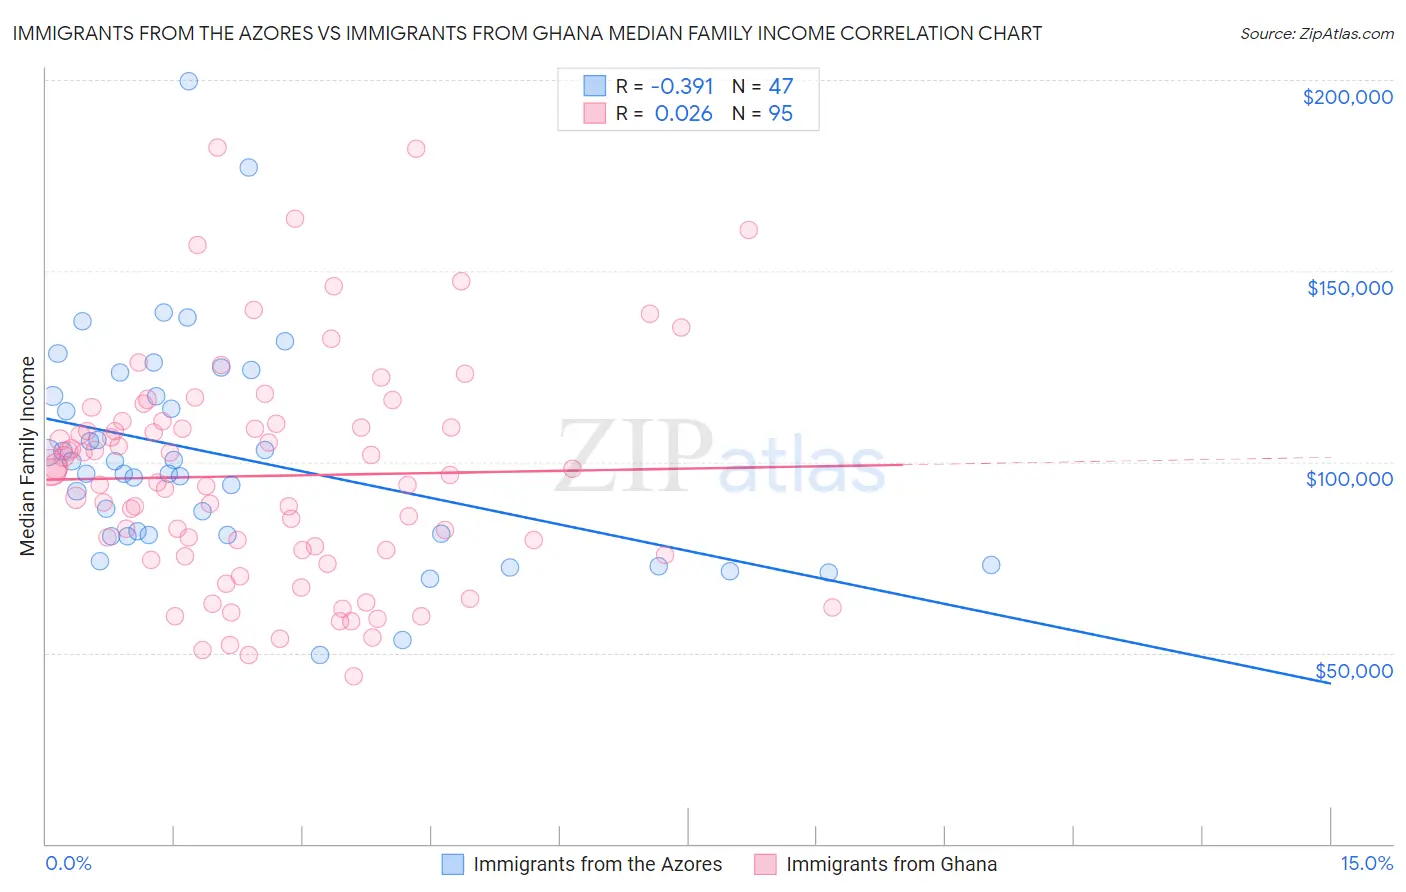
Immigrants from the Azores vs Immigrants from Ghana Median Family Income Correlation Chart
The statistical analysis conducted on geographies consisting of 46,255,736 people shows a mild negative correlation between the proportion of Immigrants from the Azores and median family income in the United States with a correlation coefficient (R) of -0.391 and weighted average of $95,402. Similarly, the statistical analysis conducted on geographies consisting of 199,771,663 people shows no correlation between the proportion of Immigrants from Ghana and median family income in the United States with a correlation coefficient (R) of 0.026 and weighted average of $96,544, a difference of 1.2%.
Median Family Income Correlation Summary
| Measurement | Immigrants from the Azores | Immigrants from Ghana |
| Minimum | $49,583 | $43,736 |
| Maximum | $199,510 | $182,203 |
| Range | $149,927 | $138,466 |
| Mean | $101,435 | $96,337 |
| Median | $96,945 | $96,719 |
| Interquartile 25% (IQ1) | $80,714 | $75,639 |
| Interquartile 75% (IQ3) | $117,338 | $110,050 |
| Interquartile Range (IQR) | $36,624 | $34,411 |
| Standard Deviation (Sample) | $28,827 | $29,276 |
| Standard Deviation (Population) | $28,519 | $29,122 |
Demographics Similar to Immigrants from the Azores and Immigrants from Ghana by Median Family Income
In terms of median family income, the demographic groups most similar to Immigrants from the Azores are Marshallese ($95,293, a difference of 0.11%), Alaska Native ($95,573, a difference of 0.18%), Malaysian ($95,230, a difference of 0.18%), Immigrants from Panama ($95,647, a difference of 0.26%), and Ecuadorian ($95,114, a difference of 0.30%). Similarly, the demographic groups most similar to Immigrants from Ghana are Immigrants from Nigeria ($96,439, a difference of 0.11%), Sudanese ($96,783, a difference of 0.25%), Venezuelan ($96,281, a difference of 0.27%), Nonimmigrants ($96,231, a difference of 0.33%), and Delaware ($96,958, a difference of 0.43%).
| Demographics | Rating | Rank | Median Family Income |
| Bermudans | 6.9 /100 | #214 | Tragic $97,577 |
| Nigerians | 6.7 /100 | #215 | Tragic $97,522 |
| Immigrants | Bosnia and Herzegovina | 6.4 /100 | #216 | Tragic $97,432 |
| Japanese | 6.0 /100 | #217 | Tragic $97,288 |
| Immigrants | Cambodia | 5.8 /100 | #218 | Tragic $97,222 |
| Delaware | 5.1 /100 | #219 | Tragic $96,958 |
| Sudanese | 4.7 /100 | #220 | Tragic $96,783 |
| Immigrants | Ghana | 4.2 /100 | #221 | Tragic $96,544 |
| Immigrants | Nigeria | 4.0 /100 | #222 | Tragic $96,439 |
| Venezuelans | 3.7 /100 | #223 | Tragic $96,281 |
| Immigrants | Nonimmigrants | 3.6 /100 | #224 | Tragic $96,231 |
| Vietnamese | 3.4 /100 | #225 | Tragic $96,123 |
| Immigrants | Panama | 2.7 /100 | #226 | Tragic $95,647 |
| Alaska Natives | 2.6 /100 | #227 | Tragic $95,573 |
| Immigrants | Azores | 2.4 /100 | #228 | Tragic $95,402 |
| Marshallese | 2.2 /100 | #229 | Tragic $95,293 |
| Malaysians | 2.2 /100 | #230 | Tragic $95,230 |
| Ecuadorians | 2.1 /100 | #231 | Tragic $95,114 |
| Immigrants | Venezuela | 1.9 /100 | #232 | Tragic $94,904 |
| Immigrants | Bangladesh | 1.6 /100 | #233 | Tragic $94,665 |
| Immigrants | Western Africa | 1.6 /100 | #234 | Tragic $94,638 |