Immigrants from Belarus vs Immigrants from Ghana Median Family Income
COMPARE
Immigrants from Belarus
Immigrants from Ghana
Median Family Income
Median Family Income Comparison
Immigrants from Belarus
Immigrants from Ghana
$114,586
MEDIAN FAMILY INCOME
99.8/ 100
METRIC RATING
61st/ 347
METRIC RANK
$96,544
MEDIAN FAMILY INCOME
4.2/ 100
METRIC RATING
221st/ 347
METRIC RANK
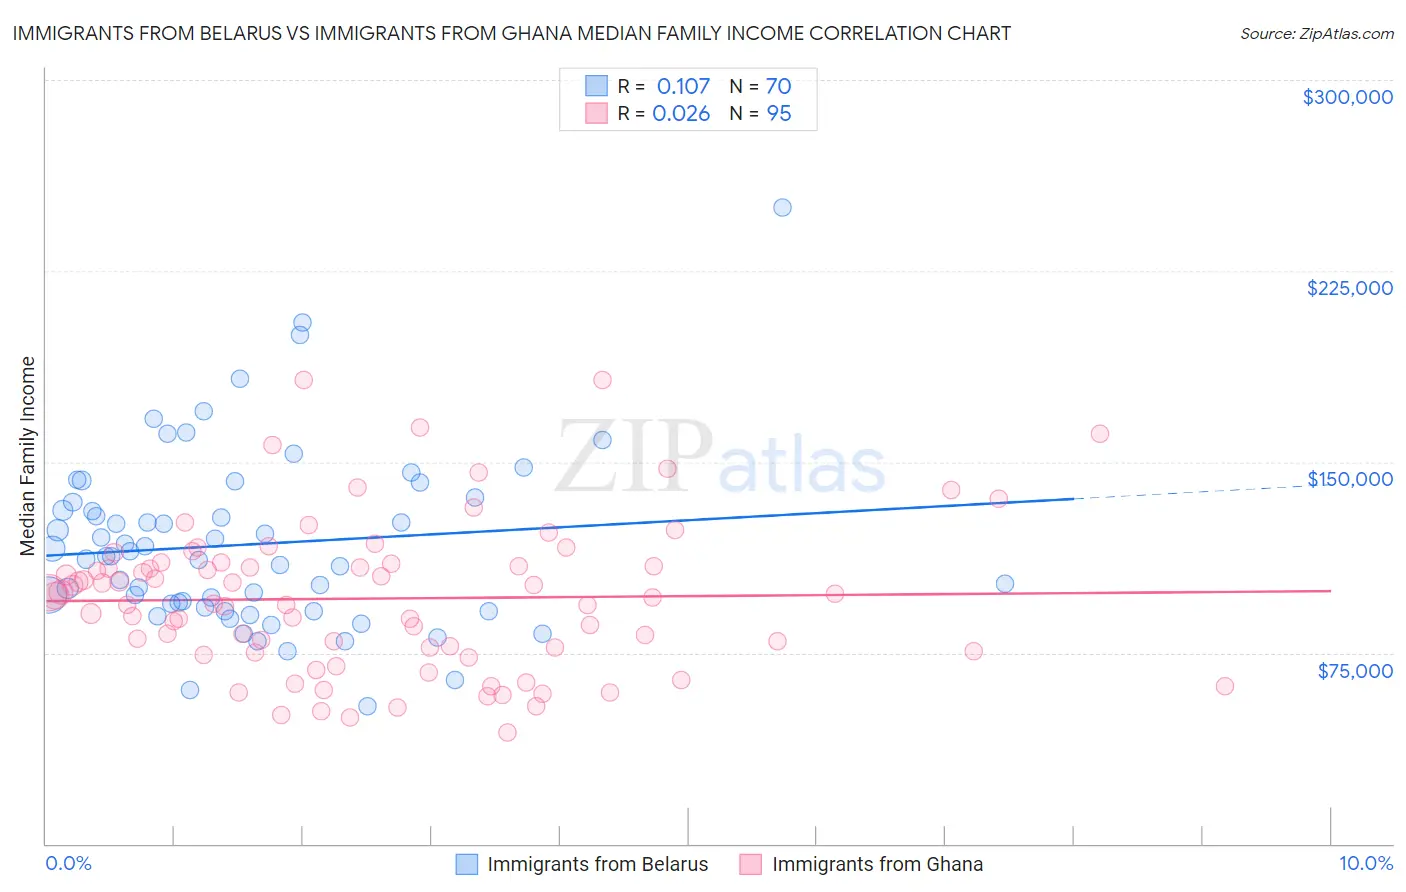
Immigrants from Belarus vs Immigrants from Ghana Median Family Income Correlation Chart
The statistical analysis conducted on geographies consisting of 150,185,977 people shows a poor positive correlation between the proportion of Immigrants from Belarus and median family income in the United States with a correlation coefficient (R) of 0.107 and weighted average of $114,586. Similarly, the statistical analysis conducted on geographies consisting of 199,771,663 people shows no correlation between the proportion of Immigrants from Ghana and median family income in the United States with a correlation coefficient (R) of 0.026 and weighted average of $96,544, a difference of 18.7%.
Median Family Income Correlation Summary
| Measurement | Immigrants from Belarus | Immigrants from Ghana |
| Minimum | $53,863 | $43,736 |
| Maximum | $250,001 | $182,203 |
| Range | $196,138 | $138,466 |
| Mean | $117,573 | $96,337 |
| Median | $112,923 | $96,719 |
| Interquartile 25% (IQ1) | $92,989 | $75,639 |
| Interquartile 75% (IQ3) | $134,250 | $110,050 |
| Interquartile Range (IQR) | $41,261 | $34,411 |
| Standard Deviation (Sample) | $34,918 | $29,276 |
| Standard Deviation (Population) | $34,668 | $29,122 |
Similar Demographics by Median Family Income
Demographics Similar to Immigrants from Belarus by Median Family Income
In terms of median family income, the demographic groups most similar to Immigrants from Belarus are Mongolian ($114,553, a difference of 0.030%), Immigrants from Pakistan ($114,406, a difference of 0.16%), Immigrants from Scotland ($114,392, a difference of 0.17%), Immigrants from Latvia ($114,826, a difference of 0.21%), and Immigrants from Netherlands ($114,987, a difference of 0.35%).
| Demographics | Rating | Rank | Median Family Income |
| Immigrants | Europe | 99.9 /100 | #54 | Exceptional $115,523 |
| Lithuanians | 99.8 /100 | #55 | Exceptional $115,395 |
| New Zealanders | 99.8 /100 | #56 | Exceptional $115,230 |
| Greeks | 99.8 /100 | #57 | Exceptional $115,192 |
| Immigrants | Indonesia | 99.8 /100 | #58 | Exceptional $115,162 |
| Immigrants | Netherlands | 99.8 /100 | #59 | Exceptional $114,987 |
| Immigrants | Latvia | 99.8 /100 | #60 | Exceptional $114,826 |
| Immigrants | Belarus | 99.8 /100 | #61 | Exceptional $114,586 |
| Mongolians | 99.8 /100 | #62 | Exceptional $114,553 |
| Immigrants | Pakistan | 99.8 /100 | #63 | Exceptional $114,406 |
| Immigrants | Scotland | 99.7 /100 | #64 | Exceptional $114,392 |
| Egyptians | 99.7 /100 | #65 | Exceptional $114,119 |
| Paraguayans | 99.7 /100 | #66 | Exceptional $114,016 |
| Immigrants | Spain | 99.7 /100 | #67 | Exceptional $113,815 |
| Immigrants | Serbia | 99.6 /100 | #68 | Exceptional $113,463 |
Demographics Similar to Immigrants from Ghana by Median Family Income
In terms of median family income, the demographic groups most similar to Immigrants from Ghana are Immigrants from Nigeria ($96,439, a difference of 0.11%), Sudanese ($96,783, a difference of 0.25%), Venezuelan ($96,281, a difference of 0.27%), Nonimmigrants ($96,231, a difference of 0.33%), and Delaware ($96,958, a difference of 0.43%).
| Demographics | Rating | Rank | Median Family Income |
| Bermudans | 6.9 /100 | #214 | Tragic $97,577 |
| Nigerians | 6.7 /100 | #215 | Tragic $97,522 |
| Immigrants | Bosnia and Herzegovina | 6.4 /100 | #216 | Tragic $97,432 |
| Japanese | 6.0 /100 | #217 | Tragic $97,288 |
| Immigrants | Cambodia | 5.8 /100 | #218 | Tragic $97,222 |
| Delaware | 5.1 /100 | #219 | Tragic $96,958 |
| Sudanese | 4.7 /100 | #220 | Tragic $96,783 |
| Immigrants | Ghana | 4.2 /100 | #221 | Tragic $96,544 |
| Immigrants | Nigeria | 4.0 /100 | #222 | Tragic $96,439 |
| Venezuelans | 3.7 /100 | #223 | Tragic $96,281 |
| Immigrants | Nonimmigrants | 3.6 /100 | #224 | Tragic $96,231 |
| Vietnamese | 3.4 /100 | #225 | Tragic $96,123 |
| Immigrants | Panama | 2.7 /100 | #226 | Tragic $95,647 |
| Alaska Natives | 2.6 /100 | #227 | Tragic $95,573 |
| Immigrants | Azores | 2.4 /100 | #228 | Tragic $95,402 |