Sierra Leonean vs Immigrants from Costa Rica Median Family Income
COMPARE
Sierra Leonean
Immigrants from Costa Rica
Median Family Income
Median Family Income Comparison
Sierra Leoneans
Immigrants from Costa Rica
$103,859
MEDIAN FAMILY INCOME
64.7/ 100
METRIC RATING
164th/ 347
METRIC RANK
$101,354
MEDIAN FAMILY INCOME
33.7/ 100
METRIC RATING
184th/ 347
METRIC RANK
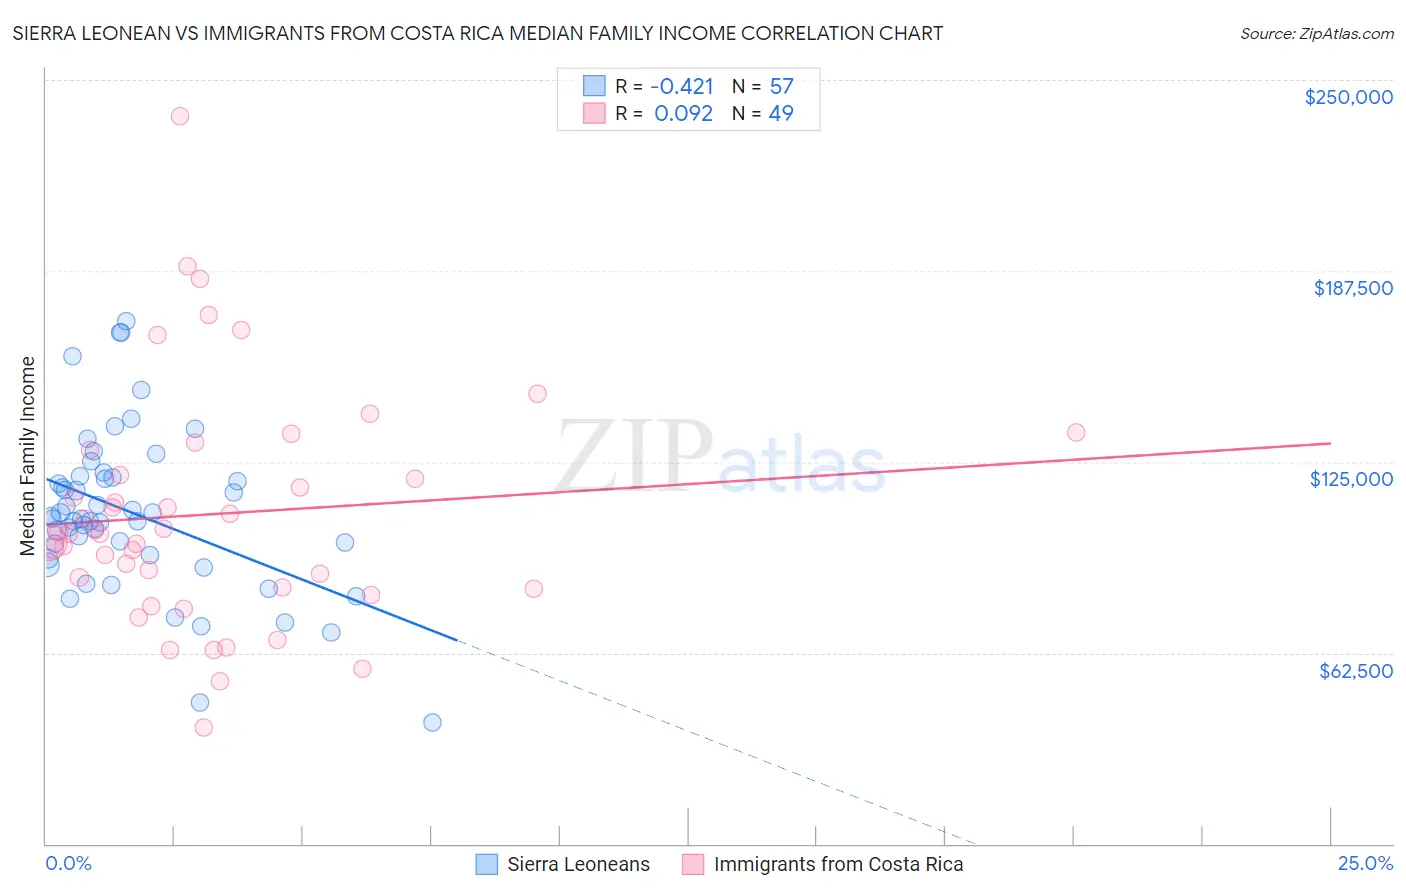
Sierra Leonean vs Immigrants from Costa Rica Median Family Income Correlation Chart
The statistical analysis conducted on geographies consisting of 83,335,449 people shows a moderate negative correlation between the proportion of Sierra Leoneans and median family income in the United States with a correlation coefficient (R) of -0.421 and weighted average of $103,859. Similarly, the statistical analysis conducted on geographies consisting of 204,217,887 people shows a slight positive correlation between the proportion of Immigrants from Costa Rica and median family income in the United States with a correlation coefficient (R) of 0.092 and weighted average of $101,354, a difference of 2.5%.
Median Family Income Correlation Summary
| Measurement | Sierra Leonean | Immigrants from Costa Rica |
| Minimum | $39,837 | $37,917 |
| Maximum | $170,916 | $238,052 |
| Range | $131,079 | $200,135 |
| Mean | $108,328 | $107,880 |
| Median | $106,551 | $101,496 |
| Interquartile 25% (IQ1) | $93,816 | $83,552 |
| Interquartile 75% (IQ3) | $120,017 | $124,823 |
| Interquartile Range (IQR) | $26,201 | $41,271 |
| Standard Deviation (Sample) | $26,389 | $38,589 |
| Standard Deviation (Population) | $26,156 | $38,194 |
Demographics Similar to Sierra Leoneans and Immigrants from Costa Rica by Median Family Income
In terms of median family income, the demographic groups most similar to Sierra Leoneans are Slovak ($103,729, a difference of 0.13%), English ($103,684, a difference of 0.17%), South American Indian ($103,624, a difference of 0.23%), Immigrants from Peru ($103,534, a difference of 0.31%), and Czechoslovakian ($103,273, a difference of 0.57%). Similarly, the demographic groups most similar to Immigrants from Costa Rica are Kenyan ($101,417, a difference of 0.060%), Tsimshian ($101,543, a difference of 0.19%), Spaniard ($101,617, a difference of 0.26%), French Canadian ($101,634, a difference of 0.28%), and South American ($101,856, a difference of 0.50%).
| Demographics | Rating | Rank | Median Family Income |
| Sierra Leoneans | 64.7 /100 | #164 | Good $103,859 |
| Slovaks | 63.1 /100 | #165 | Good $103,729 |
| English | 62.6 /100 | #166 | Good $103,684 |
| South American Indians | 61.9 /100 | #167 | Good $103,624 |
| Immigrants | Peru | 60.8 /100 | #168 | Good $103,534 |
| Czechoslovakians | 57.6 /100 | #169 | Average $103,273 |
| Immigrants | Uzbekistan | 56.6 /100 | #170 | Average $103,197 |
| Alsatians | 54.3 /100 | #171 | Average $103,010 |
| Immigrants | Eritrea | 51.9 /100 | #172 | Average $102,823 |
| Belgians | 51.4 /100 | #173 | Average $102,788 |
| Finns | 50.0 /100 | #174 | Average $102,676 |
| Immigrants | Eastern Africa | 47.1 /100 | #175 | Average $102,451 |
| French | 46.1 /100 | #176 | Average $102,368 |
| Germans | 44.6 /100 | #177 | Average $102,254 |
| Welsh | 43.3 /100 | #178 | Average $102,151 |
| South Americans | 39.7 /100 | #179 | Fair $101,856 |
| French Canadians | 37.0 /100 | #180 | Fair $101,634 |
| Spaniards | 36.8 /100 | #181 | Fair $101,617 |
| Tsimshian | 35.9 /100 | #182 | Fair $101,543 |
| Kenyans | 34.5 /100 | #183 | Fair $101,417 |
| Immigrants | Costa Rica | 33.7 /100 | #184 | Fair $101,354 |