Immigrants from Africa vs Immigrants from Costa Rica Median Family Income
COMPARE
Immigrants from Africa
Immigrants from Costa Rica
Median Family Income
Median Family Income Comparison
Immigrants from Africa
Immigrants from Costa Rica
$100,256
MEDIAN FAMILY INCOME
22.5/ 100
METRIC RATING
198th/ 347
METRIC RANK
$101,354
MEDIAN FAMILY INCOME
33.7/ 100
METRIC RATING
184th/ 347
METRIC RANK
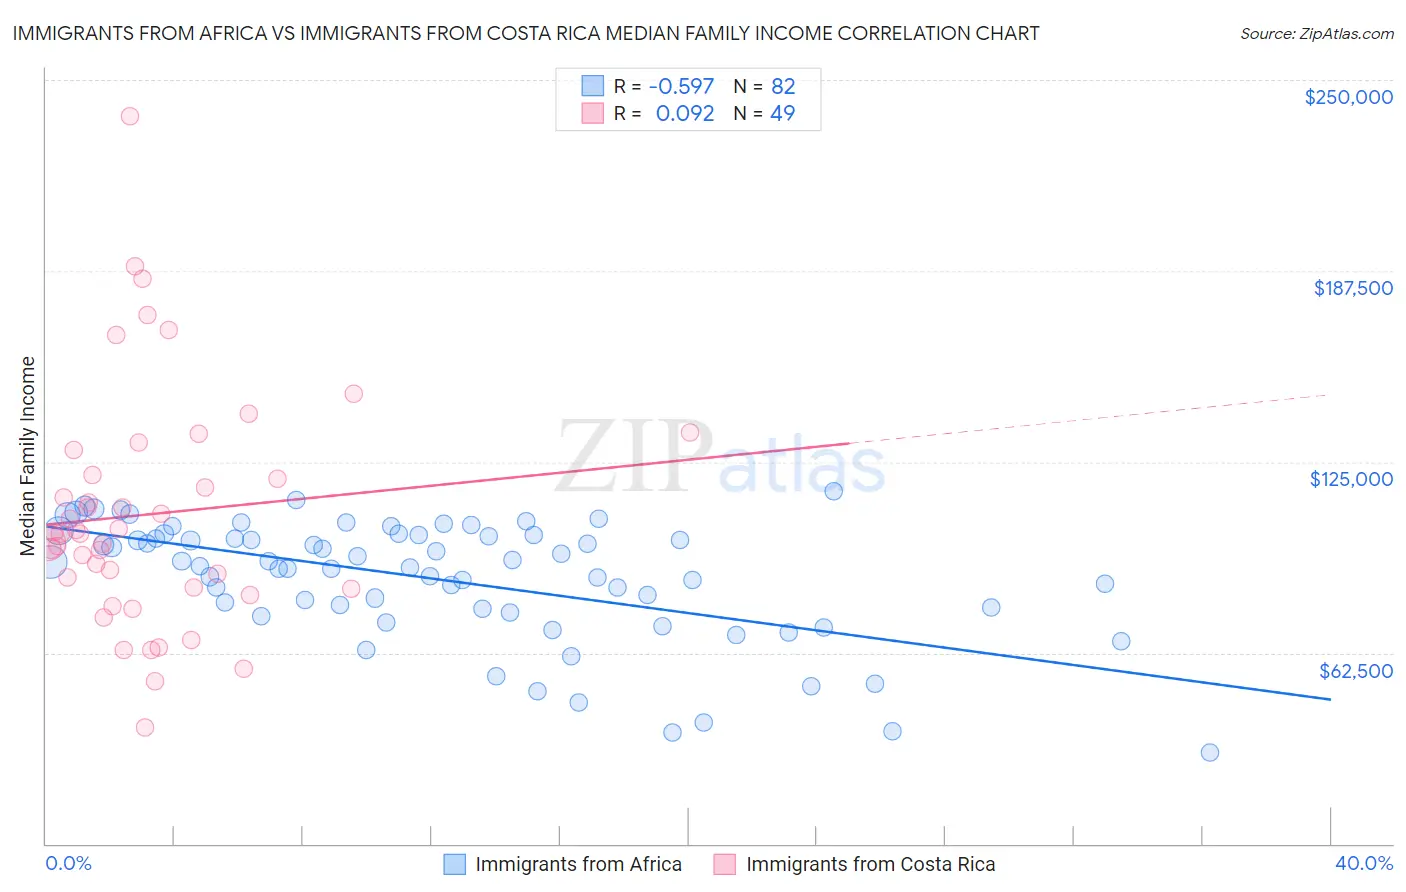
Immigrants from Africa vs Immigrants from Costa Rica Median Family Income Correlation Chart
The statistical analysis conducted on geographies consisting of 468,709,431 people shows a substantial negative correlation between the proportion of Immigrants from Africa and median family income in the United States with a correlation coefficient (R) of -0.597 and weighted average of $100,256. Similarly, the statistical analysis conducted on geographies consisting of 204,217,887 people shows a slight positive correlation between the proportion of Immigrants from Costa Rica and median family income in the United States with a correlation coefficient (R) of 0.092 and weighted average of $101,354, a difference of 1.1%.
Median Family Income Correlation Summary
| Measurement | Immigrants from Africa | Immigrants from Costa Rica |
| Minimum | $29,978 | $37,917 |
| Maximum | $115,502 | $238,052 |
| Range | $85,524 | $200,135 |
| Mean | $86,633 | $107,880 |
| Median | $91,514 | $101,496 |
| Interquartile 25% (IQ1) | $76,824 | $83,552 |
| Interquartile 75% (IQ3) | $100,972 | $124,823 |
| Interquartile Range (IQR) | $24,148 | $41,271 |
| Standard Deviation (Sample) | $19,648 | $38,589 |
| Standard Deviation (Population) | $19,528 | $38,194 |
Demographics Similar to Immigrants from Africa and Immigrants from Costa Rica by Median Family Income
In terms of median family income, the demographic groups most similar to Immigrants from Africa are Immigrants from Cameroon ($100,289, a difference of 0.030%), Samoan ($100,344, a difference of 0.090%), Yugoslavian ($100,119, a difference of 0.14%), Immigrants from South America ($100,414, a difference of 0.16%), and Spanish ($99,977, a difference of 0.28%). Similarly, the demographic groups most similar to Immigrants from Costa Rica are Kenyan ($101,417, a difference of 0.060%), Dutch ($101,192, a difference of 0.16%), Tsimshian ($101,543, a difference of 0.19%), Celtic ($101,139, a difference of 0.21%), and Spaniard ($101,617, a difference of 0.26%).
| Demographics | Rating | Rank | Median Family Income |
| Spaniards | 36.8 /100 | #181 | Fair $101,617 |
| Tsimshian | 35.9 /100 | #182 | Fair $101,543 |
| Kenyans | 34.5 /100 | #183 | Fair $101,417 |
| Immigrants | Costa Rica | 33.7 /100 | #184 | Fair $101,354 |
| Dutch | 31.9 /100 | #185 | Fair $101,192 |
| Celtics | 31.3 /100 | #186 | Fair $101,139 |
| Tlingit-Haida | 30.8 /100 | #187 | Fair $101,092 |
| Guamanians/Chamorros | 30.5 /100 | #188 | Fair $101,061 |
| Immigrants | Portugal | 29.6 /100 | #189 | Fair $100,984 |
| Immigrants | Immigrants | 29.4 /100 | #190 | Fair $100,962 |
| Colombians | 27.2 /100 | #191 | Fair $100,750 |
| Immigrants | Kenya | 26.5 /100 | #192 | Fair $100,679 |
| Iraqis | 26.3 /100 | #193 | Fair $100,658 |
| Uruguayans | 26.3 /100 | #194 | Fair $100,656 |
| Immigrants | South America | 23.9 /100 | #195 | Fair $100,414 |
| Samoans | 23.3 /100 | #196 | Fair $100,344 |
| Immigrants | Cameroon | 22.8 /100 | #197 | Fair $100,289 |
| Immigrants | Africa | 22.5 /100 | #198 | Fair $100,256 |
| Yugoslavians | 21.3 /100 | #199 | Fair $100,119 |
| Spanish | 20.1 /100 | #200 | Fair $99,977 |
| Immigrants | Thailand | 19.0 /100 | #201 | Poor $99,840 |