Scotch-Irish vs Immigrants from Central America Median Male Earnings
COMPARE
Scotch-Irish
Immigrants from Central America
Median Male Earnings
Median Male Earnings Comparison
Scotch-Irish
Immigrants from Central America
$53,658
MEDIAN MALE EARNINGS
30.6/ 100
METRIC RATING
192nd/ 347
METRIC RANK
$45,538
MEDIAN MALE EARNINGS
0.0/ 100
METRIC RATING
323rd/ 347
METRIC RANK
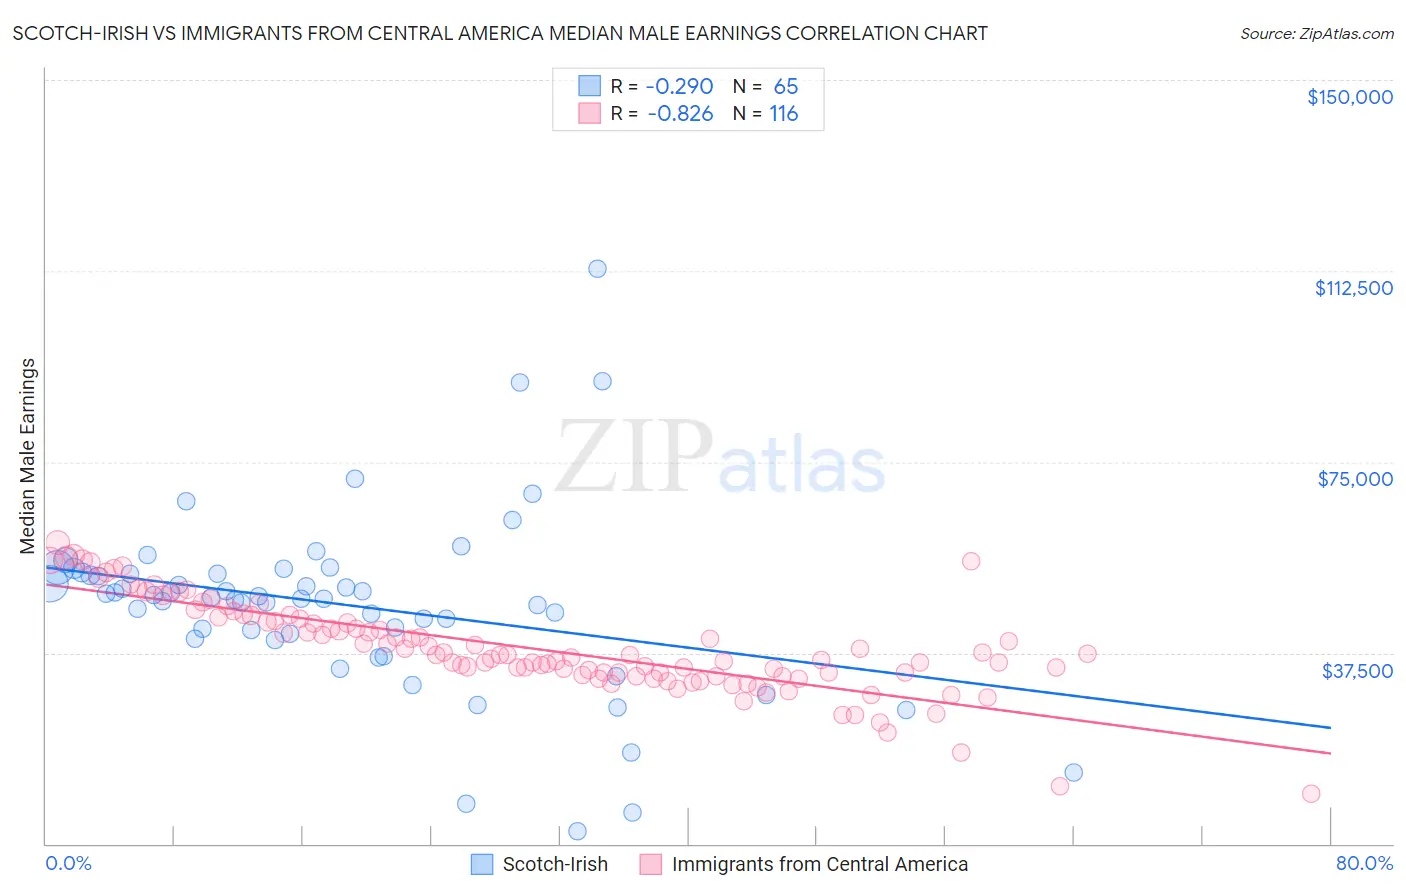
Scotch-Irish vs Immigrants from Central America Median Male Earnings Correlation Chart
The statistical analysis conducted on geographies consisting of 547,724,250 people shows a weak negative correlation between the proportion of Scotch-Irish and median male earnings in the United States with a correlation coefficient (R) of -0.290 and weighted average of $53,658. Similarly, the statistical analysis conducted on geographies consisting of 535,785,073 people shows a very strong negative correlation between the proportion of Immigrants from Central America and median male earnings in the United States with a correlation coefficient (R) of -0.826 and weighted average of $45,538, a difference of 17.8%.
Median Male Earnings Correlation Summary
| Measurement | Scotch-Irish | Immigrants from Central America |
| Minimum | $2,499 | $9,917 |
| Maximum | $113,000 | $59,113 |
| Range | $110,501 | $49,196 |
| Mean | $47,040 | $38,565 |
| Median | $48,432 | $37,031 |
| Interquartile 25% (IQ1) | $40,813 | $33,411 |
| Interquartile 75% (IQ3) | $53,223 | $44,421 |
| Interquartile Range (IQR) | $12,411 | $11,009 |
| Standard Deviation (Sample) | $17,914 | $9,104 |
| Standard Deviation (Population) | $17,776 | $9,065 |
Similar Demographics by Median Male Earnings
Demographics Similar to Scotch-Irish by Median Male Earnings
In terms of median male earnings, the demographic groups most similar to Scotch-Irish are Guamanian/Chamorro ($53,661, a difference of 0.010%), Kenyan ($53,647, a difference of 0.020%), Uruguayan ($53,680, a difference of 0.040%), Puget Sound Salish ($53,704, a difference of 0.090%), and Immigrants from Eastern Africa ($53,713, a difference of 0.10%).
| Demographics | Rating | Rank | Median Male Earnings |
| Immigrants | Sierra Leone | 36.0 /100 | #185 | Fair $53,905 |
| Colombians | 34.4 /100 | #186 | Fair $53,832 |
| Immigrants | Eritrea | 31.8 /100 | #187 | Fair $53,715 |
| Immigrants | Eastern Africa | 31.8 /100 | #188 | Fair $53,713 |
| Puget Sound Salish | 31.6 /100 | #189 | Fair $53,704 |
| Uruguayans | 31.1 /100 | #190 | Fair $53,680 |
| Guamanians/Chamorros | 30.7 /100 | #191 | Fair $53,661 |
| Scotch-Irish | 30.6 /100 | #192 | Fair $53,658 |
| Kenyans | 30.4 /100 | #193 | Fair $53,647 |
| Spanish | 29.0 /100 | #194 | Fair $53,576 |
| Immigrants | Azores | 27.5 /100 | #195 | Fair $53,503 |
| Immigrants | Africa | 26.6 /100 | #196 | Fair $53,457 |
| Immigrants | Kenya | 26.0 /100 | #197 | Fair $53,427 |
| Immigrants | Costa Rica | 22.6 /100 | #198 | Fair $53,237 |
| Tongans | 22.3 /100 | #199 | Fair $53,218 |
Demographics Similar to Immigrants from Central America by Median Male Earnings
In terms of median male earnings, the demographic groups most similar to Immigrants from Central America are Black/African American ($45,523, a difference of 0.030%), Sioux ($45,566, a difference of 0.060%), Fijian ($45,607, a difference of 0.15%), Yuman ($45,446, a difference of 0.20%), and Immigrants from Honduras ($45,787, a difference of 0.55%).
| Demographics | Rating | Rank | Median Male Earnings |
| Immigrants | Caribbean | 0.0 /100 | #316 | Tragic $46,193 |
| Mexicans | 0.0 /100 | #317 | Tragic $46,147 |
| Cheyenne | 0.0 /100 | #318 | Tragic $46,062 |
| Haitians | 0.0 /100 | #319 | Tragic $45,903 |
| Immigrants | Honduras | 0.0 /100 | #320 | Tragic $45,787 |
| Fijians | 0.0 /100 | #321 | Tragic $45,607 |
| Sioux | 0.0 /100 | #322 | Tragic $45,566 |
| Immigrants | Central America | 0.0 /100 | #323 | Tragic $45,538 |
| Blacks/African Americans | 0.0 /100 | #324 | Tragic $45,523 |
| Yuman | 0.0 /100 | #325 | Tragic $45,446 |
| Immigrants | Haiti | 0.0 /100 | #326 | Tragic $45,266 |
| Immigrants | Bahamas | 0.0 /100 | #327 | Tragic $45,176 |
| Kiowa | 0.0 /100 | #328 | Tragic $45,094 |
| Yakama | 0.0 /100 | #329 | Tragic $45,002 |
| Immigrants | Mexico | 0.0 /100 | #330 | Tragic $44,960 |