Immigrants from Afghanistan vs Immigrants from Central America Median Male Earnings
COMPARE
Immigrants from Afghanistan
Immigrants from Central America
Median Male Earnings
Median Male Earnings Comparison
Immigrants from Afghanistan
Immigrants from Central America
$57,582
MEDIAN MALE EARNINGS
95.4/ 100
METRIC RATING
112th/ 347
METRIC RANK
$45,538
MEDIAN MALE EARNINGS
0.0/ 100
METRIC RATING
323rd/ 347
METRIC RANK
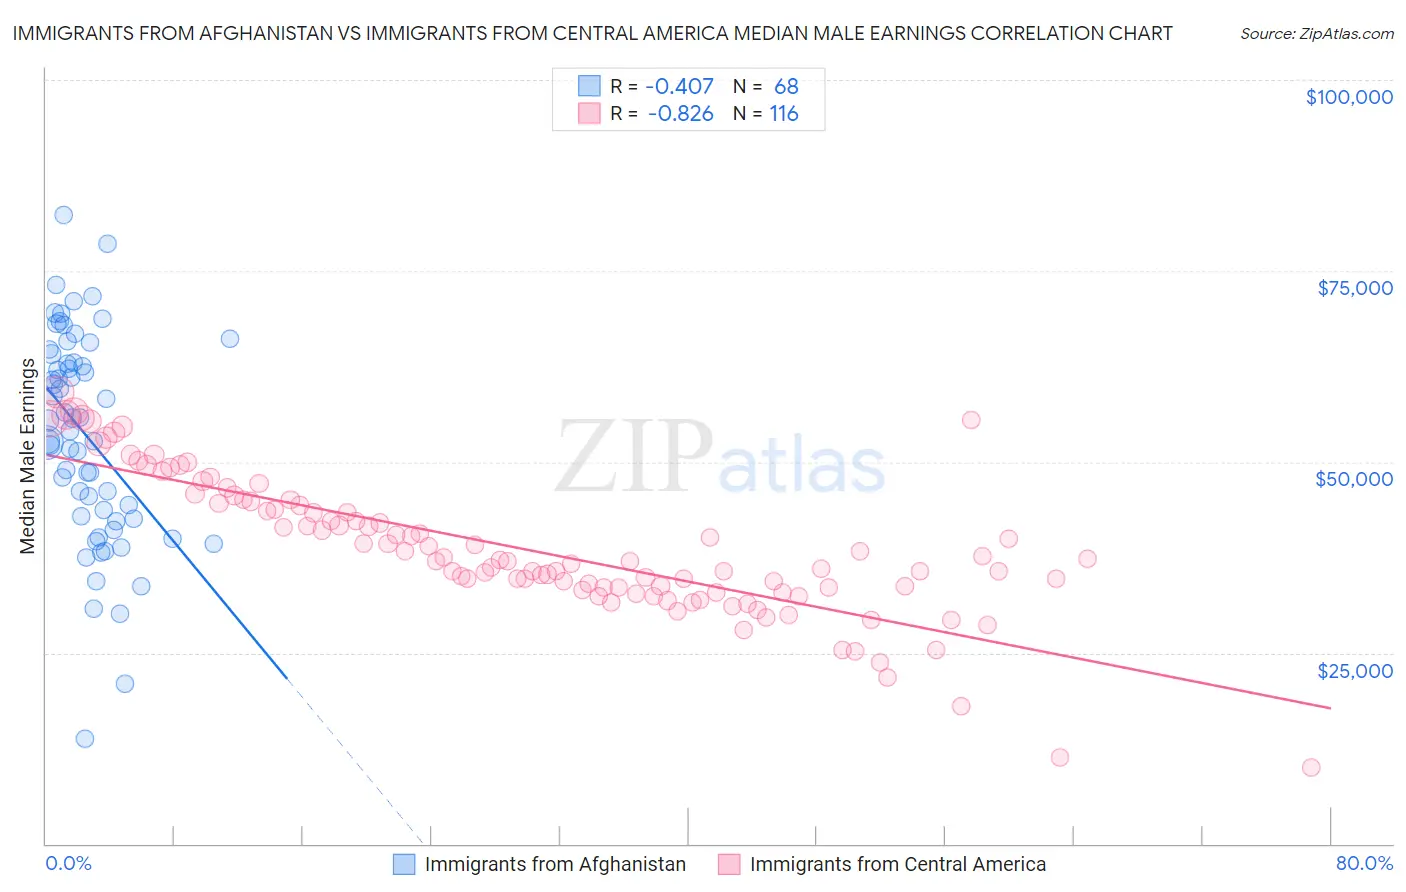
Immigrants from Afghanistan vs Immigrants from Central America Median Male Earnings Correlation Chart
The statistical analysis conducted on geographies consisting of 147,642,339 people shows a moderate negative correlation between the proportion of Immigrants from Afghanistan and median male earnings in the United States with a correlation coefficient (R) of -0.407 and weighted average of $57,582. Similarly, the statistical analysis conducted on geographies consisting of 535,785,073 people shows a very strong negative correlation between the proportion of Immigrants from Central America and median male earnings in the United States with a correlation coefficient (R) of -0.826 and weighted average of $45,538, a difference of 26.5%.
Median Male Earnings Correlation Summary
| Measurement | Immigrants from Afghanistan | Immigrants from Central America |
| Minimum | $13,824 | $9,917 |
| Maximum | $82,319 | $59,113 |
| Range | $68,496 | $49,196 |
| Mean | $53,392 | $38,565 |
| Median | $54,756 | $37,031 |
| Interquartile 25% (IQ1) | $42,712 | $33,411 |
| Interquartile 75% (IQ3) | $63,573 | $44,421 |
| Interquartile Range (IQR) | $20,861 | $11,009 |
| Standard Deviation (Sample) | $13,746 | $9,104 |
| Standard Deviation (Population) | $13,644 | $9,065 |
Similar Demographics by Median Male Earnings
Demographics Similar to Immigrants from Afghanistan by Median Male Earnings
In terms of median male earnings, the demographic groups most similar to Immigrants from Afghanistan are Carpatho Rusyn ($57,572, a difference of 0.020%), Immigrants from Kuwait ($57,562, a difference of 0.040%), European ($57,637, a difference of 0.090%), Swedish ($57,445, a difference of 0.24%), and Lebanese ($57,409, a difference of 0.30%).
| Demographics | Rating | Rank | Median Male Earnings |
| Immigrants | Western Asia | 97.3 /100 | #105 | Exceptional $58,131 |
| Immigrants | Northern Africa | 96.9 /100 | #106 | Exceptional $58,008 |
| Serbians | 96.8 /100 | #107 | Exceptional $57,975 |
| Immigrants | Uzbekistan | 96.7 /100 | #108 | Exceptional $57,941 |
| British | 96.5 /100 | #109 | Exceptional $57,890 |
| Palestinians | 96.2 /100 | #110 | Exceptional $57,778 |
| Europeans | 95.6 /100 | #111 | Exceptional $57,637 |
| Immigrants | Afghanistan | 95.4 /100 | #112 | Exceptional $57,582 |
| Carpatho Rusyns | 95.3 /100 | #113 | Exceptional $57,572 |
| Immigrants | Kuwait | 95.3 /100 | #114 | Exceptional $57,562 |
| Swedes | 94.8 /100 | #115 | Exceptional $57,445 |
| Lebanese | 94.6 /100 | #116 | Exceptional $57,409 |
| Immigrants | Zimbabwe | 94.3 /100 | #117 | Exceptional $57,352 |
| Hungarians | 94.0 /100 | #118 | Exceptional $57,309 |
| Arabs | 94.0 /100 | #119 | Exceptional $57,298 |
Demographics Similar to Immigrants from Central America by Median Male Earnings
In terms of median male earnings, the demographic groups most similar to Immigrants from Central America are Black/African American ($45,523, a difference of 0.030%), Sioux ($45,566, a difference of 0.060%), Fijian ($45,607, a difference of 0.15%), Yuman ($45,446, a difference of 0.20%), and Immigrants from Honduras ($45,787, a difference of 0.55%).
| Demographics | Rating | Rank | Median Male Earnings |
| Immigrants | Caribbean | 0.0 /100 | #316 | Tragic $46,193 |
| Mexicans | 0.0 /100 | #317 | Tragic $46,147 |
| Cheyenne | 0.0 /100 | #318 | Tragic $46,062 |
| Haitians | 0.0 /100 | #319 | Tragic $45,903 |
| Immigrants | Honduras | 0.0 /100 | #320 | Tragic $45,787 |
| Fijians | 0.0 /100 | #321 | Tragic $45,607 |
| Sioux | 0.0 /100 | #322 | Tragic $45,566 |
| Immigrants | Central America | 0.0 /100 | #323 | Tragic $45,538 |
| Blacks/African Americans | 0.0 /100 | #324 | Tragic $45,523 |
| Yuman | 0.0 /100 | #325 | Tragic $45,446 |
| Immigrants | Haiti | 0.0 /100 | #326 | Tragic $45,266 |
| Immigrants | Bahamas | 0.0 /100 | #327 | Tragic $45,176 |
| Kiowa | 0.0 /100 | #328 | Tragic $45,094 |
| Yakama | 0.0 /100 | #329 | Tragic $45,002 |
| Immigrants | Mexico | 0.0 /100 | #330 | Tragic $44,960 |