Scotch-Irish vs Cherokee Median Male Earnings
COMPARE
Scotch-Irish
Cherokee
Median Male Earnings
Median Male Earnings Comparison
Scotch-Irish
Cherokee
$53,658
MEDIAN MALE EARNINGS
30.6/ 100
METRIC RATING
192nd/ 347
METRIC RANK
$48,669
MEDIAN MALE EARNINGS
0.3/ 100
METRIC RATING
271st/ 347
METRIC RANK
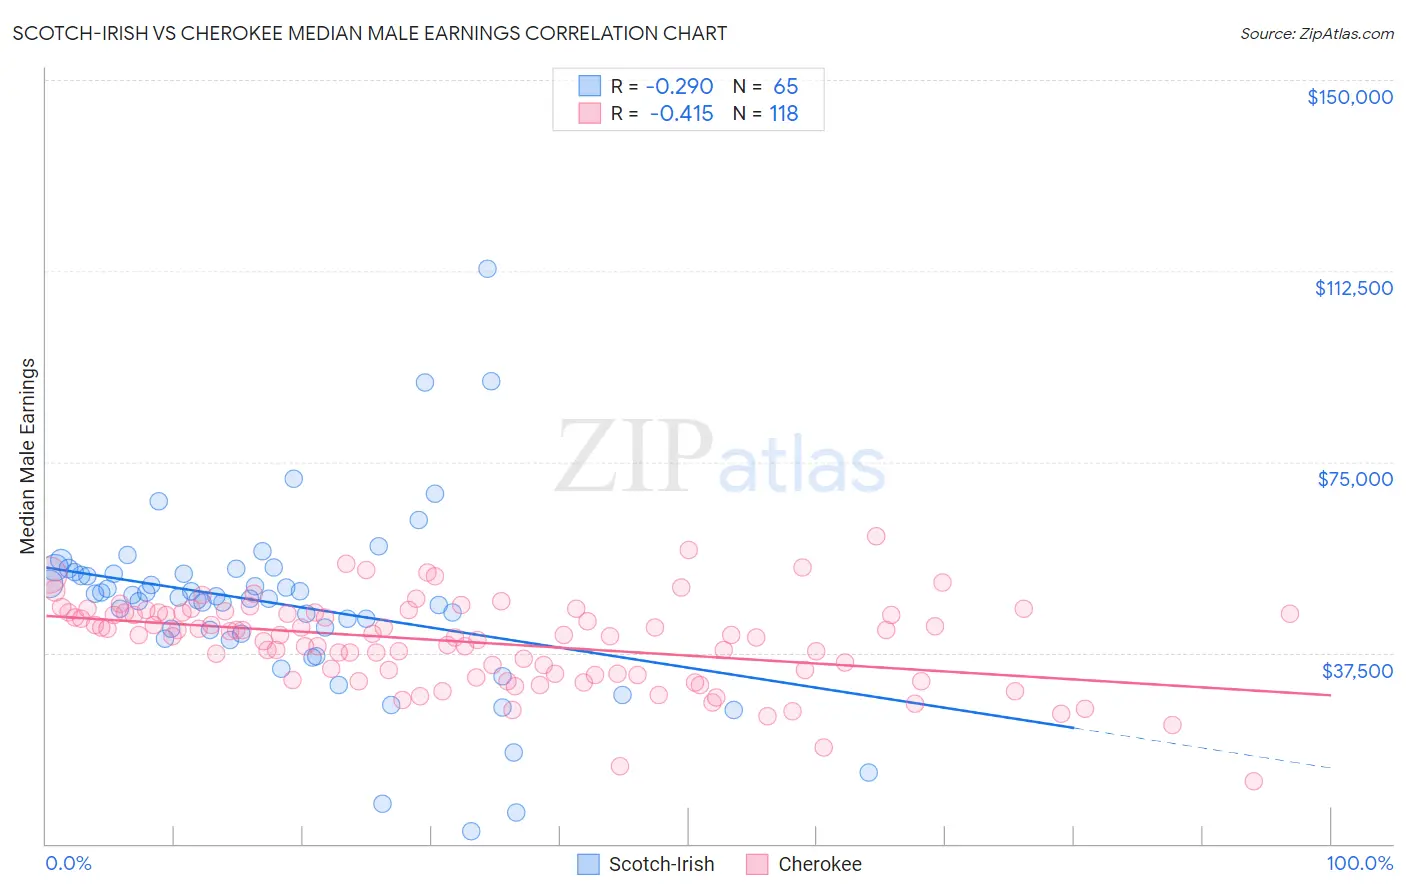
Scotch-Irish vs Cherokee Median Male Earnings Correlation Chart
The statistical analysis conducted on geographies consisting of 547,724,250 people shows a weak negative correlation between the proportion of Scotch-Irish and median male earnings in the United States with a correlation coefficient (R) of -0.290 and weighted average of $53,658. Similarly, the statistical analysis conducted on geographies consisting of 493,193,856 people shows a moderate negative correlation between the proportion of Cherokee and median male earnings in the United States with a correlation coefficient (R) of -0.415 and weighted average of $48,669, a difference of 10.2%.
Median Male Earnings Correlation Summary
| Measurement | Scotch-Irish | Cherokee |
| Minimum | $2,499 | $12,361 |
| Maximum | $113,000 | $60,438 |
| Range | $110,501 | $48,077 |
| Mean | $47,040 | $39,586 |
| Median | $48,432 | $40,957 |
| Interquartile 25% (IQ1) | $40,813 | $33,308 |
| Interquartile 75% (IQ3) | $53,223 | $45,365 |
| Interquartile Range (IQR) | $12,411 | $12,057 |
| Standard Deviation (Sample) | $17,914 | $8,544 |
| Standard Deviation (Population) | $17,776 | $8,508 |
Similar Demographics by Median Male Earnings
Demographics Similar to Scotch-Irish by Median Male Earnings
In terms of median male earnings, the demographic groups most similar to Scotch-Irish are Guamanian/Chamorro ($53,661, a difference of 0.010%), Kenyan ($53,647, a difference of 0.020%), Uruguayan ($53,680, a difference of 0.040%), Puget Sound Salish ($53,704, a difference of 0.090%), and Immigrants from Eastern Africa ($53,713, a difference of 0.10%).
| Demographics | Rating | Rank | Median Male Earnings |
| Immigrants | Sierra Leone | 36.0 /100 | #185 | Fair $53,905 |
| Colombians | 34.4 /100 | #186 | Fair $53,832 |
| Immigrants | Eritrea | 31.8 /100 | #187 | Fair $53,715 |
| Immigrants | Eastern Africa | 31.8 /100 | #188 | Fair $53,713 |
| Puget Sound Salish | 31.6 /100 | #189 | Fair $53,704 |
| Uruguayans | 31.1 /100 | #190 | Fair $53,680 |
| Guamanians/Chamorros | 30.7 /100 | #191 | Fair $53,661 |
| Scotch-Irish | 30.6 /100 | #192 | Fair $53,658 |
| Kenyans | 30.4 /100 | #193 | Fair $53,647 |
| Spanish | 29.0 /100 | #194 | Fair $53,576 |
| Immigrants | Azores | 27.5 /100 | #195 | Fair $53,503 |
| Immigrants | Africa | 26.6 /100 | #196 | Fair $53,457 |
| Immigrants | Kenya | 26.0 /100 | #197 | Fair $53,427 |
| Immigrants | Costa Rica | 22.6 /100 | #198 | Fair $53,237 |
| Tongans | 22.3 /100 | #199 | Fair $53,218 |
Demographics Similar to Cherokee by Median Male Earnings
In terms of median male earnings, the demographic groups most similar to Cherokee are Salvadoran ($48,646, a difference of 0.050%), Jamaican ($48,632, a difference of 0.080%), Potawatomi ($48,768, a difference of 0.20%), Colville ($48,516, a difference of 0.32%), and Tsimshian ($48,836, a difference of 0.34%).
| Demographics | Rating | Rank | Median Male Earnings |
| Immigrants | Middle Africa | 0.6 /100 | #264 | Tragic $49,201 |
| Immigrants | Laos | 0.6 /100 | #265 | Tragic $49,190 |
| Somalis | 0.5 /100 | #266 | Tragic $49,025 |
| Spanish Americans | 0.5 /100 | #267 | Tragic $49,008 |
| Ute | 0.4 /100 | #268 | Tragic $48,899 |
| Tsimshian | 0.4 /100 | #269 | Tragic $48,836 |
| Potawatomi | 0.4 /100 | #270 | Tragic $48,768 |
| Cherokee | 0.3 /100 | #271 | Tragic $48,669 |
| Salvadorans | 0.3 /100 | #272 | Tragic $48,646 |
| Jamaicans | 0.3 /100 | #273 | Tragic $48,632 |
| Colville | 0.3 /100 | #274 | Tragic $48,516 |
| Immigrants | Somalia | 0.3 /100 | #275 | Tragic $48,439 |
| Blackfeet | 0.3 /100 | #276 | Tragic $48,402 |
| Belizeans | 0.2 /100 | #277 | Tragic $48,358 |
| Immigrants | Liberia | 0.2 /100 | #278 | Tragic $48,317 |