Scotch-Irish vs Thai Median Male Earnings
COMPARE
Scotch-Irish
Thai
Median Male Earnings
Median Male Earnings Comparison
Scotch-Irish
Thais
$53,658
MEDIAN MALE EARNINGS
30.6/ 100
METRIC RATING
192nd/ 347
METRIC RANK
$72,135
MEDIAN MALE EARNINGS
100.0/ 100
METRIC RATING
4th/ 347
METRIC RANK
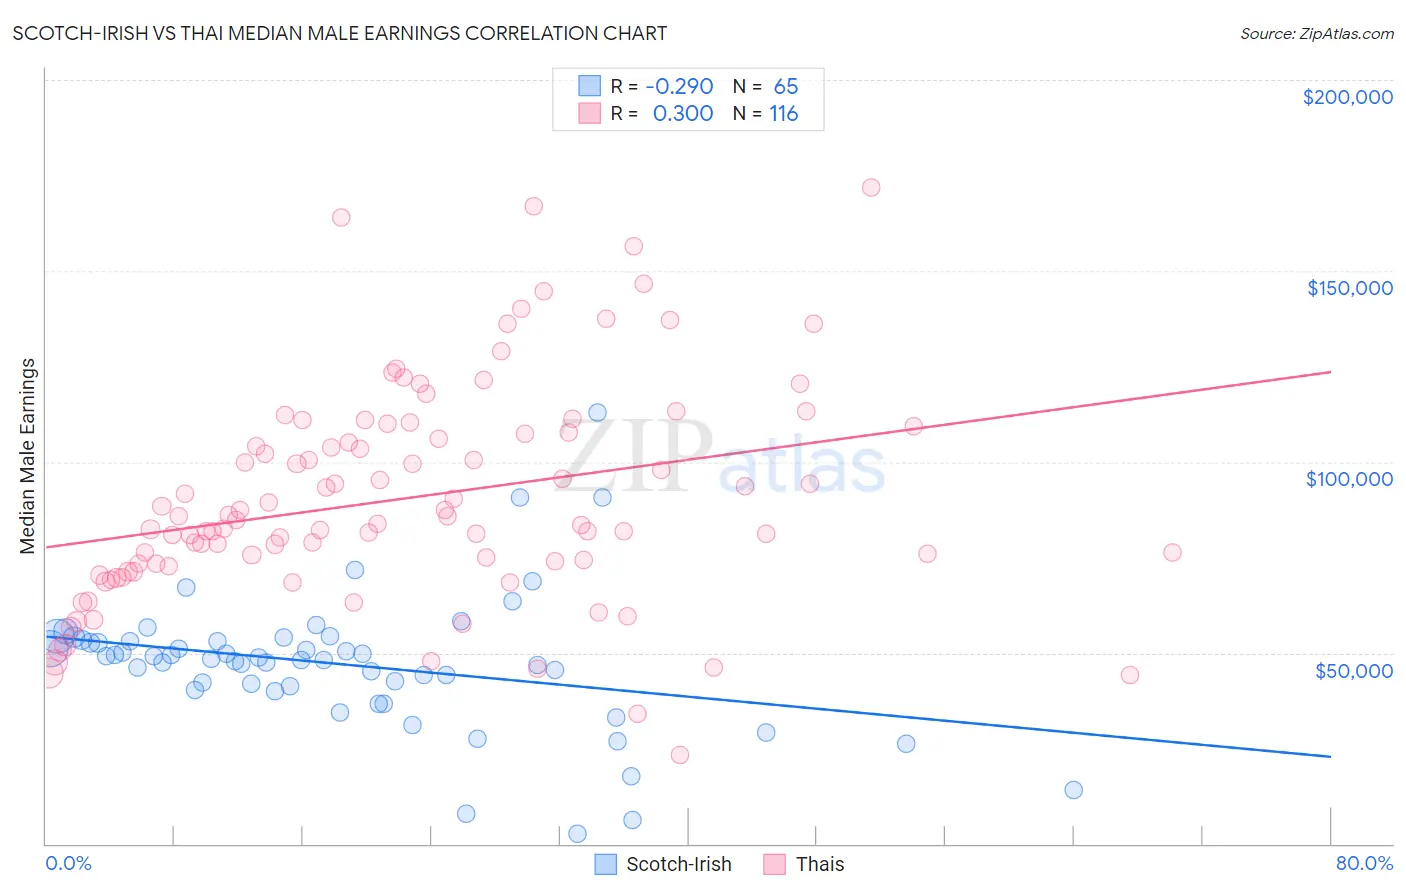
Scotch-Irish vs Thai Median Male Earnings Correlation Chart
The statistical analysis conducted on geographies consisting of 547,724,250 people shows a weak negative correlation between the proportion of Scotch-Irish and median male earnings in the United States with a correlation coefficient (R) of -0.290 and weighted average of $53,658. Similarly, the statistical analysis conducted on geographies consisting of 475,691,954 people shows a weak positive correlation between the proportion of Thais and median male earnings in the United States with a correlation coefficient (R) of 0.300 and weighted average of $72,135, a difference of 34.4%.
Median Male Earnings Correlation Summary
| Measurement | Scotch-Irish | Thai |
| Minimum | $2,499 | $23,362 |
| Maximum | $113,000 | $171,875 |
| Range | $110,501 | $148,513 |
| Mean | $47,040 | $90,264 |
| Median | $48,432 | $84,301 |
| Interquartile 25% (IQ1) | $40,813 | $73,018 |
| Interquartile 75% (IQ3) | $53,223 | $107,587 |
| Interquartile Range (IQR) | $12,411 | $34,569 |
| Standard Deviation (Sample) | $17,914 | $28,453 |
| Standard Deviation (Population) | $17,776 | $28,330 |
Similar Demographics by Median Male Earnings
Demographics Similar to Scotch-Irish by Median Male Earnings
In terms of median male earnings, the demographic groups most similar to Scotch-Irish are Guamanian/Chamorro ($53,661, a difference of 0.010%), Kenyan ($53,647, a difference of 0.020%), Uruguayan ($53,680, a difference of 0.040%), Puget Sound Salish ($53,704, a difference of 0.090%), and Immigrants from Eastern Africa ($53,713, a difference of 0.10%).
| Demographics | Rating | Rank | Median Male Earnings |
| Immigrants | Sierra Leone | 36.0 /100 | #185 | Fair $53,905 |
| Colombians | 34.4 /100 | #186 | Fair $53,832 |
| Immigrants | Eritrea | 31.8 /100 | #187 | Fair $53,715 |
| Immigrants | Eastern Africa | 31.8 /100 | #188 | Fair $53,713 |
| Puget Sound Salish | 31.6 /100 | #189 | Fair $53,704 |
| Uruguayans | 31.1 /100 | #190 | Fair $53,680 |
| Guamanians/Chamorros | 30.7 /100 | #191 | Fair $53,661 |
| Scotch-Irish | 30.6 /100 | #192 | Fair $53,658 |
| Kenyans | 30.4 /100 | #193 | Fair $53,647 |
| Spanish | 29.0 /100 | #194 | Fair $53,576 |
| Immigrants | Azores | 27.5 /100 | #195 | Fair $53,503 |
| Immigrants | Africa | 26.6 /100 | #196 | Fair $53,457 |
| Immigrants | Kenya | 26.0 /100 | #197 | Fair $53,427 |
| Immigrants | Costa Rica | 22.6 /100 | #198 | Fair $53,237 |
| Tongans | 22.3 /100 | #199 | Fair $53,218 |
Demographics Similar to Thais by Median Male Earnings
In terms of median male earnings, the demographic groups most similar to Thais are Immigrants from Singapore ($71,348, a difference of 1.1%), Iranian ($70,648, a difference of 2.1%), Immigrants from Taiwan ($74,031, a difference of 2.6%), Immigrants from Hong Kong ($70,146, a difference of 2.8%), and Immigrants from India ($74,207, a difference of 2.9%).
| Demographics | Rating | Rank | Median Male Earnings |
| Filipinos | 100.0 /100 | #1 | Exceptional $74,224 |
| Immigrants | India | 100.0 /100 | #2 | Exceptional $74,207 |
| Immigrants | Taiwan | 100.0 /100 | #3 | Exceptional $74,031 |
| Thais | 100.0 /100 | #4 | Exceptional $72,135 |
| Immigrants | Singapore | 100.0 /100 | #5 | Exceptional $71,348 |
| Iranians | 100.0 /100 | #6 | Exceptional $70,648 |
| Immigrants | Hong Kong | 100.0 /100 | #7 | Exceptional $70,146 |
| Immigrants | Iran | 100.0 /100 | #8 | Exceptional $69,284 |
| Immigrants | South Central Asia | 100.0 /100 | #9 | Exceptional $68,960 |
| Immigrants | Israel | 100.0 /100 | #10 | Exceptional $68,716 |
| Immigrants | Ireland | 100.0 /100 | #11 | Exceptional $67,698 |
| Immigrants | Australia | 100.0 /100 | #12 | Exceptional $67,634 |
| Immigrants | China | 100.0 /100 | #13 | Exceptional $67,353 |
| Okinawans | 100.0 /100 | #14 | Exceptional $67,232 |
| Immigrants | Eastern Asia | 100.0 /100 | #15 | Exceptional $66,903 |