Yakama vs Alaskan Athabascan Median Male Earnings
COMPARE
Yakama
Alaskan Athabascan
Median Male Earnings
Median Male Earnings Comparison
Yakama
Alaskan Athabascans
$45,002
MEDIAN MALE EARNINGS
0.0/ 100
METRIC RATING
329th/ 347
METRIC RANK
$49,748
MEDIAN MALE EARNINGS
0.9/ 100
METRIC RATING
255th/ 347
METRIC RANK
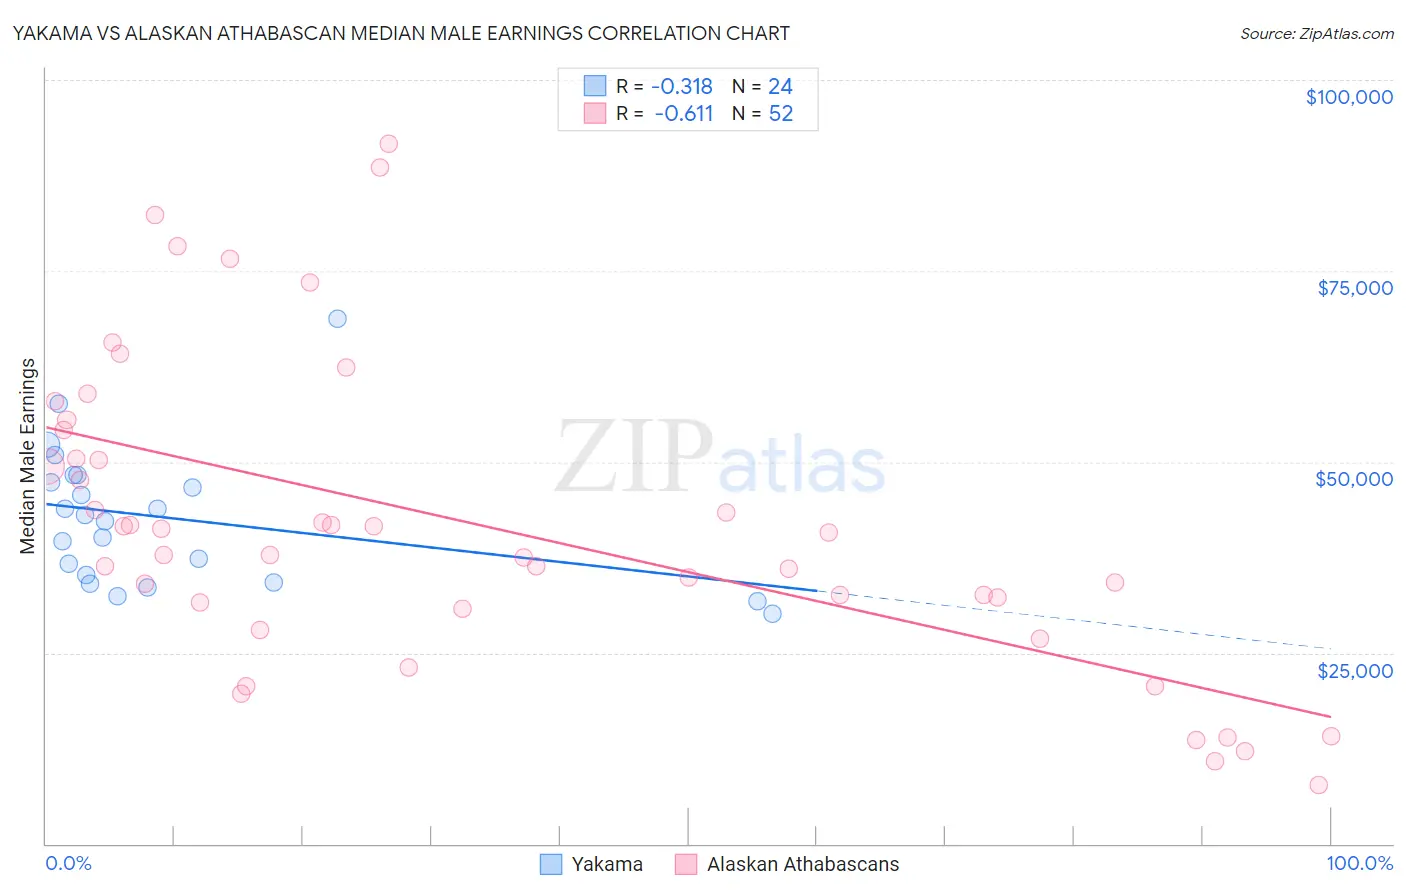
Yakama vs Alaskan Athabascan Median Male Earnings Correlation Chart
The statistical analysis conducted on geographies consisting of 19,920,033 people shows a mild negative correlation between the proportion of Yakama and median male earnings in the United States with a correlation coefficient (R) of -0.318 and weighted average of $45,002. Similarly, the statistical analysis conducted on geographies consisting of 45,804,380 people shows a significant negative correlation between the proportion of Alaskan Athabascans and median male earnings in the United States with a correlation coefficient (R) of -0.611 and weighted average of $49,748, a difference of 10.5%.
Median Male Earnings Correlation Summary
| Measurement | Yakama | Alaskan Athabascan |
| Minimum | $30,179 | $7,708 |
| Maximum | $68,750 | $91,667 |
| Range | $38,571 | $83,959 |
| Mean | $42,657 | $41,933 |
| Median | $42,664 | $39,323 |
| Interquartile 25% (IQ1) | $34,669 | $31,226 |
| Interquartile 75% (IQ3) | $47,788 | $52,255 |
| Interquartile Range (IQR) | $13,119 | $21,029 |
| Standard Deviation (Sample) | $9,142 | $20,193 |
| Standard Deviation (Population) | $8,950 | $19,997 |
Similar Demographics by Median Male Earnings
Demographics Similar to Yakama by Median Male Earnings
In terms of median male earnings, the demographic groups most similar to Yakama are Immigrants from Mexico ($44,960, a difference of 0.090%), Kiowa ($45,094, a difference of 0.20%), Immigrants from Bahamas ($45,176, a difference of 0.39%), Native/Alaskan ($44,775, a difference of 0.51%), and Bahamian ($44,756, a difference of 0.55%).
| Demographics | Rating | Rank | Median Male Earnings |
| Sioux | 0.0 /100 | #322 | Tragic $45,566 |
| Immigrants | Central America | 0.0 /100 | #323 | Tragic $45,538 |
| Blacks/African Americans | 0.0 /100 | #324 | Tragic $45,523 |
| Yuman | 0.0 /100 | #325 | Tragic $45,446 |
| Immigrants | Haiti | 0.0 /100 | #326 | Tragic $45,266 |
| Immigrants | Bahamas | 0.0 /100 | #327 | Tragic $45,176 |
| Kiowa | 0.0 /100 | #328 | Tragic $45,094 |
| Yakama | 0.0 /100 | #329 | Tragic $45,002 |
| Immigrants | Mexico | 0.0 /100 | #330 | Tragic $44,960 |
| Natives/Alaskans | 0.0 /100 | #331 | Tragic $44,775 |
| Bahamians | 0.0 /100 | #332 | Tragic $44,756 |
| Immigrants | Congo | 0.0 /100 | #333 | Tragic $44,204 |
| Immigrants | Yemen | 0.0 /100 | #334 | Tragic $44,083 |
| Spanish American Indians | 0.0 /100 | #335 | Tragic $44,010 |
| Immigrants | Cuba | 0.0 /100 | #336 | Tragic $43,461 |
Demographics Similar to Alaskan Athabascans by Median Male Earnings
In terms of median male earnings, the demographic groups most similar to Alaskan Athabascans are Senegalese ($49,774, a difference of 0.050%), Alaska Native ($49,711, a difference of 0.070%), British West Indian ($49,636, a difference of 0.23%), German Russian ($49,924, a difference of 0.35%), and Cree ($49,497, a difference of 0.51%).
| Demographics | Rating | Rank | Median Male Earnings |
| Immigrants | Guyana | 1.6 /100 | #248 | Tragic $50,321 |
| Immigrants | Burma/Myanmar | 1.6 /100 | #249 | Tragic $50,298 |
| Osage | 1.6 /100 | #250 | Tragic $50,292 |
| Immigrants | Grenada | 1.6 /100 | #251 | Tragic $50,279 |
| Immigrants | Cabo Verde | 1.2 /100 | #252 | Tragic $50,009 |
| German Russians | 1.1 /100 | #253 | Tragic $49,924 |
| Senegalese | 1.0 /100 | #254 | Tragic $49,774 |
| Alaskan Athabascans | 0.9 /100 | #255 | Tragic $49,748 |
| Alaska Natives | 0.9 /100 | #256 | Tragic $49,711 |
| British West Indians | 0.8 /100 | #257 | Tragic $49,636 |
| Cree | 0.7 /100 | #258 | Tragic $49,497 |
| Nepalese | 0.7 /100 | #259 | Tragic $49,458 |
| Iroquois | 0.7 /100 | #260 | Tragic $49,374 |
| Liberians | 0.6 /100 | #261 | Tragic $49,318 |
| Immigrants | West Indies | 0.6 /100 | #262 | Tragic $49,271 |