Ute vs Alaskan Athabascan Median Male Earnings
COMPARE
Ute
Alaskan Athabascan
Median Male Earnings
Median Male Earnings Comparison
Ute
Alaskan Athabascans
$48,899
MEDIAN MALE EARNINGS
0.4/ 100
METRIC RATING
268th/ 347
METRIC RANK
$49,748
MEDIAN MALE EARNINGS
0.9/ 100
METRIC RATING
255th/ 347
METRIC RANK
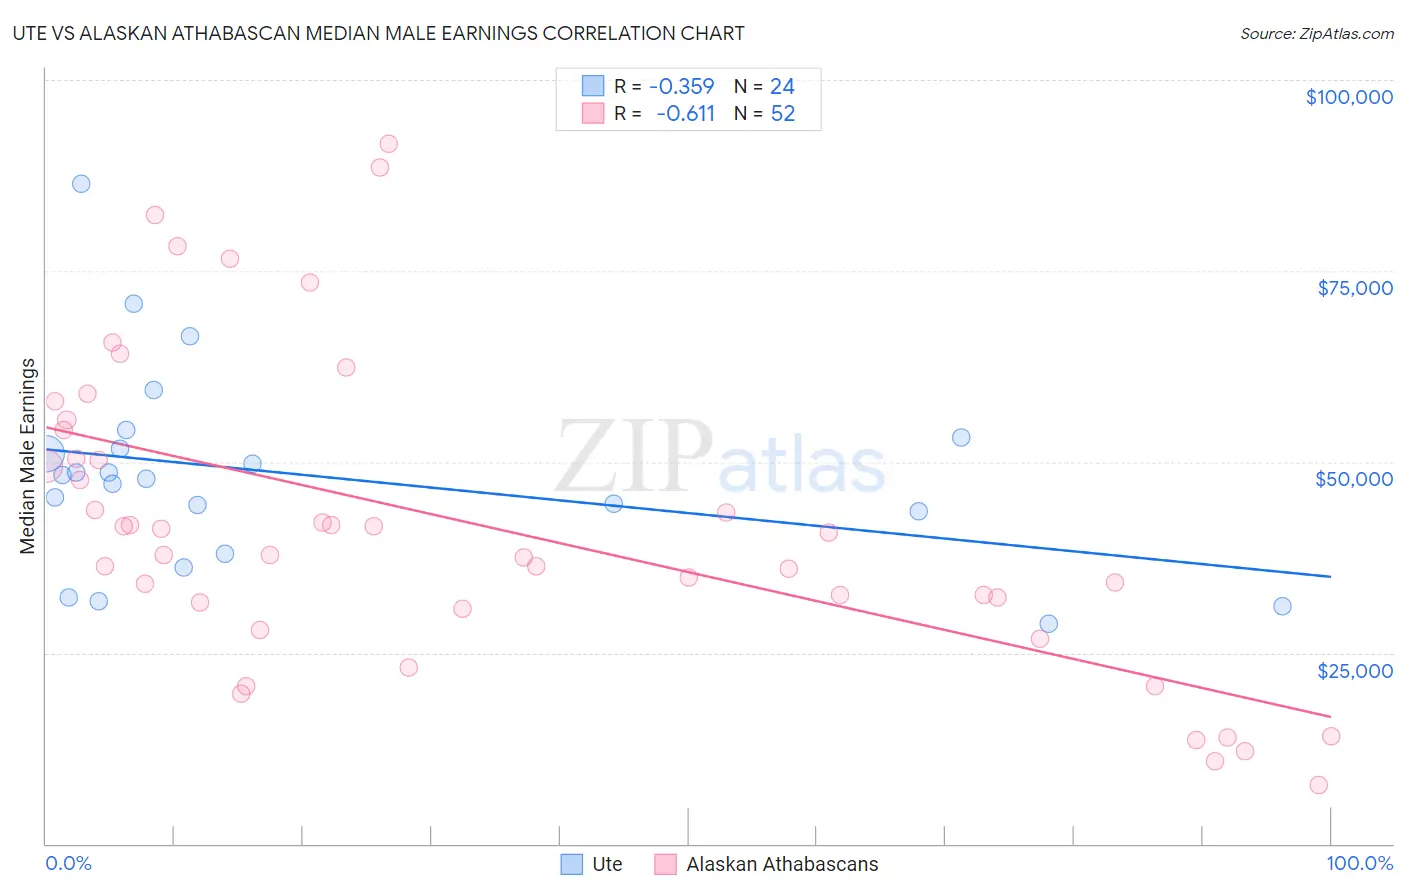
Ute vs Alaskan Athabascan Median Male Earnings Correlation Chart
The statistical analysis conducted on geographies consisting of 55,657,801 people shows a mild negative correlation between the proportion of Ute and median male earnings in the United States with a correlation coefficient (R) of -0.359 and weighted average of $48,899. Similarly, the statistical analysis conducted on geographies consisting of 45,804,380 people shows a significant negative correlation between the proportion of Alaskan Athabascans and median male earnings in the United States with a correlation coefficient (R) of -0.611 and weighted average of $49,748, a difference of 1.7%.
Median Male Earnings Correlation Summary
| Measurement | Ute | Alaskan Athabascan |
| Minimum | $28,875 | $7,708 |
| Maximum | $86,490 | $91,667 |
| Range | $57,615 | $83,959 |
| Mean | $48,301 | $41,933 |
| Median | $47,968 | $39,323 |
| Interquartile 25% (IQ1) | $40,774 | $31,226 |
| Interquartile 75% (IQ3) | $52,454 | $52,255 |
| Interquartile Range (IQR) | $11,681 | $21,029 |
| Standard Deviation (Sample) | $13,224 | $20,193 |
| Standard Deviation (Population) | $12,945 | $19,997 |
Demographics Similar to Ute and Alaskan Athabascans by Median Male Earnings
In terms of median male earnings, the demographic groups most similar to Ute are Tsimshian ($48,836, a difference of 0.13%), Spanish American ($49,008, a difference of 0.22%), Somali ($49,025, a difference of 0.26%), Potawatomi ($48,768, a difference of 0.27%), and Cherokee ($48,669, a difference of 0.47%). Similarly, the demographic groups most similar to Alaskan Athabascans are Senegalese ($49,774, a difference of 0.050%), Alaska Native ($49,711, a difference of 0.070%), British West Indian ($49,636, a difference of 0.23%), German Russian ($49,924, a difference of 0.35%), and Cree ($49,497, a difference of 0.51%).
| Demographics | Rating | Rank | Median Male Earnings |
| Immigrants | Grenada | 1.6 /100 | #251 | Tragic $50,279 |
| Immigrants | Cabo Verde | 1.2 /100 | #252 | Tragic $50,009 |
| German Russians | 1.1 /100 | #253 | Tragic $49,924 |
| Senegalese | 1.0 /100 | #254 | Tragic $49,774 |
| Alaskan Athabascans | 0.9 /100 | #255 | Tragic $49,748 |
| Alaska Natives | 0.9 /100 | #256 | Tragic $49,711 |
| British West Indians | 0.8 /100 | #257 | Tragic $49,636 |
| Cree | 0.7 /100 | #258 | Tragic $49,497 |
| Nepalese | 0.7 /100 | #259 | Tragic $49,458 |
| Iroquois | 0.7 /100 | #260 | Tragic $49,374 |
| Liberians | 0.6 /100 | #261 | Tragic $49,318 |
| Immigrants | West Indies | 0.6 /100 | #262 | Tragic $49,271 |
| Nicaraguans | 0.6 /100 | #263 | Tragic $49,215 |
| Immigrants | Middle Africa | 0.6 /100 | #264 | Tragic $49,201 |
| Immigrants | Laos | 0.6 /100 | #265 | Tragic $49,190 |
| Somalis | 0.5 /100 | #266 | Tragic $49,025 |
| Spanish Americans | 0.5 /100 | #267 | Tragic $49,008 |
| Ute | 0.4 /100 | #268 | Tragic $48,899 |
| Tsimshian | 0.4 /100 | #269 | Tragic $48,836 |
| Potawatomi | 0.4 /100 | #270 | Tragic $48,768 |
| Cherokee | 0.3 /100 | #271 | Tragic $48,669 |