Immigrants from Scotland vs Alaskan Athabascan Median Male Earnings
COMPARE
Immigrants from Scotland
Alaskan Athabascan
Median Male Earnings
Median Male Earnings Comparison
Immigrants from Scotland
Alaskan Athabascans
$61,220
MEDIAN MALE EARNINGS
99.9/ 100
METRIC RATING
57th/ 347
METRIC RANK
$49,748
MEDIAN MALE EARNINGS
0.9/ 100
METRIC RATING
255th/ 347
METRIC RANK
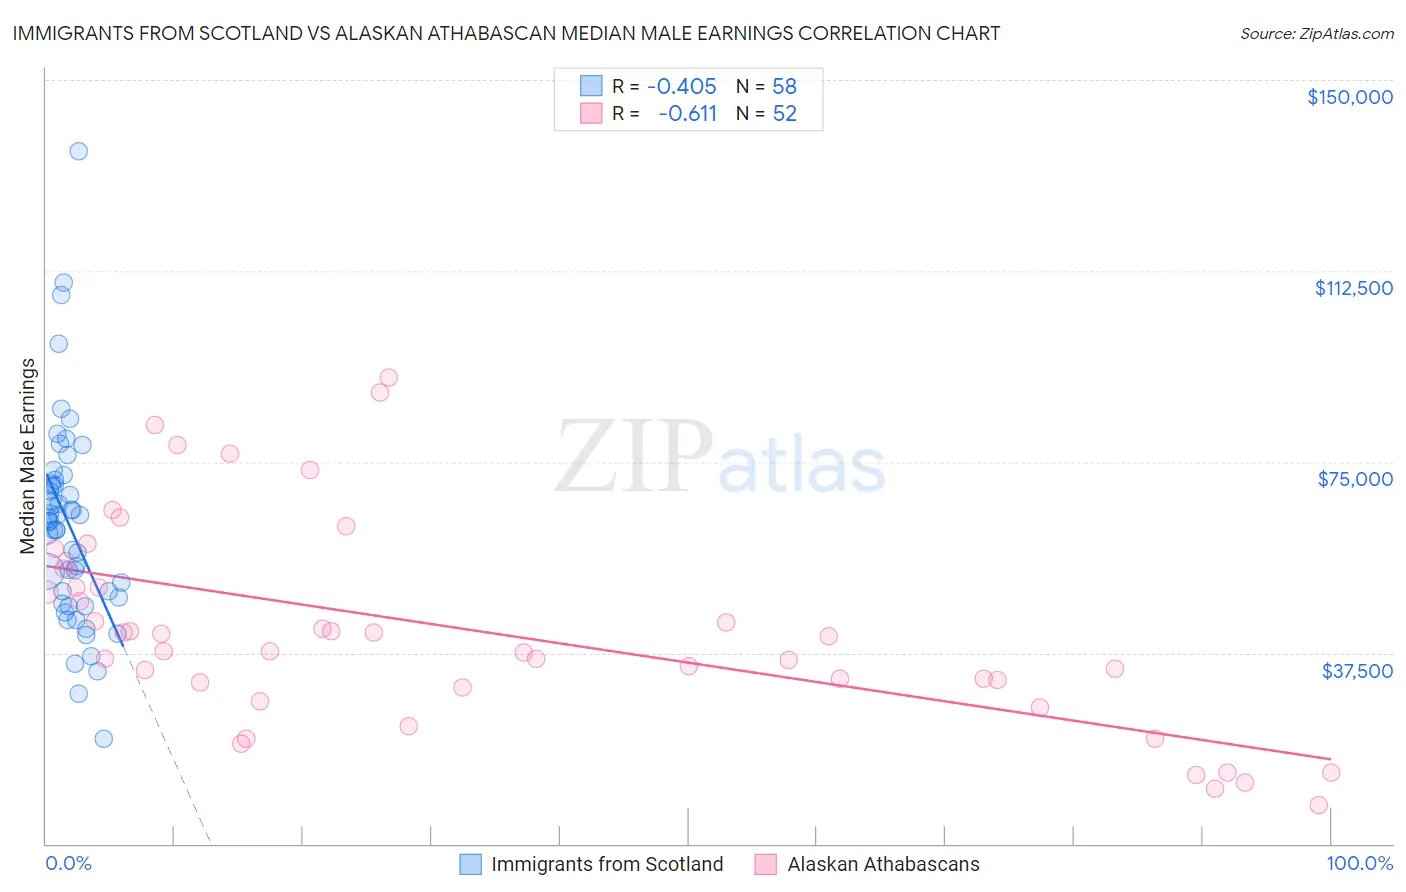
Immigrants from Scotland vs Alaskan Athabascan Median Male Earnings Correlation Chart
The statistical analysis conducted on geographies consisting of 196,362,899 people shows a moderate negative correlation between the proportion of Immigrants from Scotland and median male earnings in the United States with a correlation coefficient (R) of -0.405 and weighted average of $61,220. Similarly, the statistical analysis conducted on geographies consisting of 45,804,380 people shows a significant negative correlation between the proportion of Alaskan Athabascans and median male earnings in the United States with a correlation coefficient (R) of -0.611 and weighted average of $49,748, a difference of 23.1%.
Median Male Earnings Correlation Summary
| Measurement | Immigrants from Scotland | Alaskan Athabascan |
| Minimum | $20,588 | $7,708 |
| Maximum | $136,042 | $91,667 |
| Range | $115,454 | $83,959 |
| Mean | $62,522 | $41,933 |
| Median | $63,347 | $39,323 |
| Interquartile 25% (IQ1) | $48,304 | $31,226 |
| Interquartile 75% (IQ3) | $70,634 | $52,255 |
| Interquartile Range (IQR) | $22,330 | $21,029 |
| Standard Deviation (Sample) | $20,135 | $20,193 |
| Standard Deviation (Population) | $19,960 | $19,997 |
Similar Demographics by Median Male Earnings
Demographics Similar to Immigrants from Scotland by Median Male Earnings
In terms of median male earnings, the demographic groups most similar to Immigrants from Scotland are Lithuanian ($61,228, a difference of 0.010%), New Zealander ($61,199, a difference of 0.030%), Greek ($61,242, a difference of 0.040%), Immigrants from Netherlands ($61,096, a difference of 0.20%), and Egyptian ($61,095, a difference of 0.20%).
| Demographics | Rating | Rank | Median Male Earnings |
| Bhutanese | 99.9 /100 | #50 | Exceptional $61,759 |
| Estonians | 99.9 /100 | #51 | Exceptional $61,710 |
| Immigrants | Norway | 99.9 /100 | #52 | Exceptional $61,628 |
| South Africans | 99.9 /100 | #53 | Exceptional $61,460 |
| Immigrants | Latvia | 99.9 /100 | #54 | Exceptional $61,422 |
| Greeks | 99.9 /100 | #55 | Exceptional $61,242 |
| Lithuanians | 99.9 /100 | #56 | Exceptional $61,228 |
| Immigrants | Scotland | 99.9 /100 | #57 | Exceptional $61,220 |
| New Zealanders | 99.9 /100 | #58 | Exceptional $61,199 |
| Immigrants | Netherlands | 99.8 /100 | #59 | Exceptional $61,096 |
| Egyptians | 99.8 /100 | #60 | Exceptional $61,095 |
| Bolivians | 99.8 /100 | #61 | Exceptional $61,066 |
| Immigrants | Romania | 99.8 /100 | #62 | Exceptional $61,040 |
| Immigrants | Pakistan | 99.8 /100 | #63 | Exceptional $60,987 |
| Immigrants | Eastern Europe | 99.8 /100 | #64 | Exceptional $60,958 |
Demographics Similar to Alaskan Athabascans by Median Male Earnings
In terms of median male earnings, the demographic groups most similar to Alaskan Athabascans are Senegalese ($49,774, a difference of 0.050%), Alaska Native ($49,711, a difference of 0.070%), British West Indian ($49,636, a difference of 0.23%), German Russian ($49,924, a difference of 0.35%), and Cree ($49,497, a difference of 0.51%).
| Demographics | Rating | Rank | Median Male Earnings |
| Immigrants | Guyana | 1.6 /100 | #248 | Tragic $50,321 |
| Immigrants | Burma/Myanmar | 1.6 /100 | #249 | Tragic $50,298 |
| Osage | 1.6 /100 | #250 | Tragic $50,292 |
| Immigrants | Grenada | 1.6 /100 | #251 | Tragic $50,279 |
| Immigrants | Cabo Verde | 1.2 /100 | #252 | Tragic $50,009 |
| German Russians | 1.1 /100 | #253 | Tragic $49,924 |
| Senegalese | 1.0 /100 | #254 | Tragic $49,774 |
| Alaskan Athabascans | 0.9 /100 | #255 | Tragic $49,748 |
| Alaska Natives | 0.9 /100 | #256 | Tragic $49,711 |
| British West Indians | 0.8 /100 | #257 | Tragic $49,636 |
| Cree | 0.7 /100 | #258 | Tragic $49,497 |
| Nepalese | 0.7 /100 | #259 | Tragic $49,458 |
| Iroquois | 0.7 /100 | #260 | Tragic $49,374 |
| Liberians | 0.6 /100 | #261 | Tragic $49,318 |
| Immigrants | West Indies | 0.6 /100 | #262 | Tragic $49,271 |