Scandinavian vs Immigrants from Serbia Professional Degree
COMPARE
Scandinavian
Immigrants from Serbia
Professional Degree
Professional Degree Comparison
Scandinavians
Immigrants from Serbia
4.2%
PROFESSIONAL DEGREE
25.8/ 100
METRIC RATING
194th/ 347
METRIC RANK
5.8%
PROFESSIONAL DEGREE
100.0/ 100
METRIC RATING
52nd/ 347
METRIC RANK
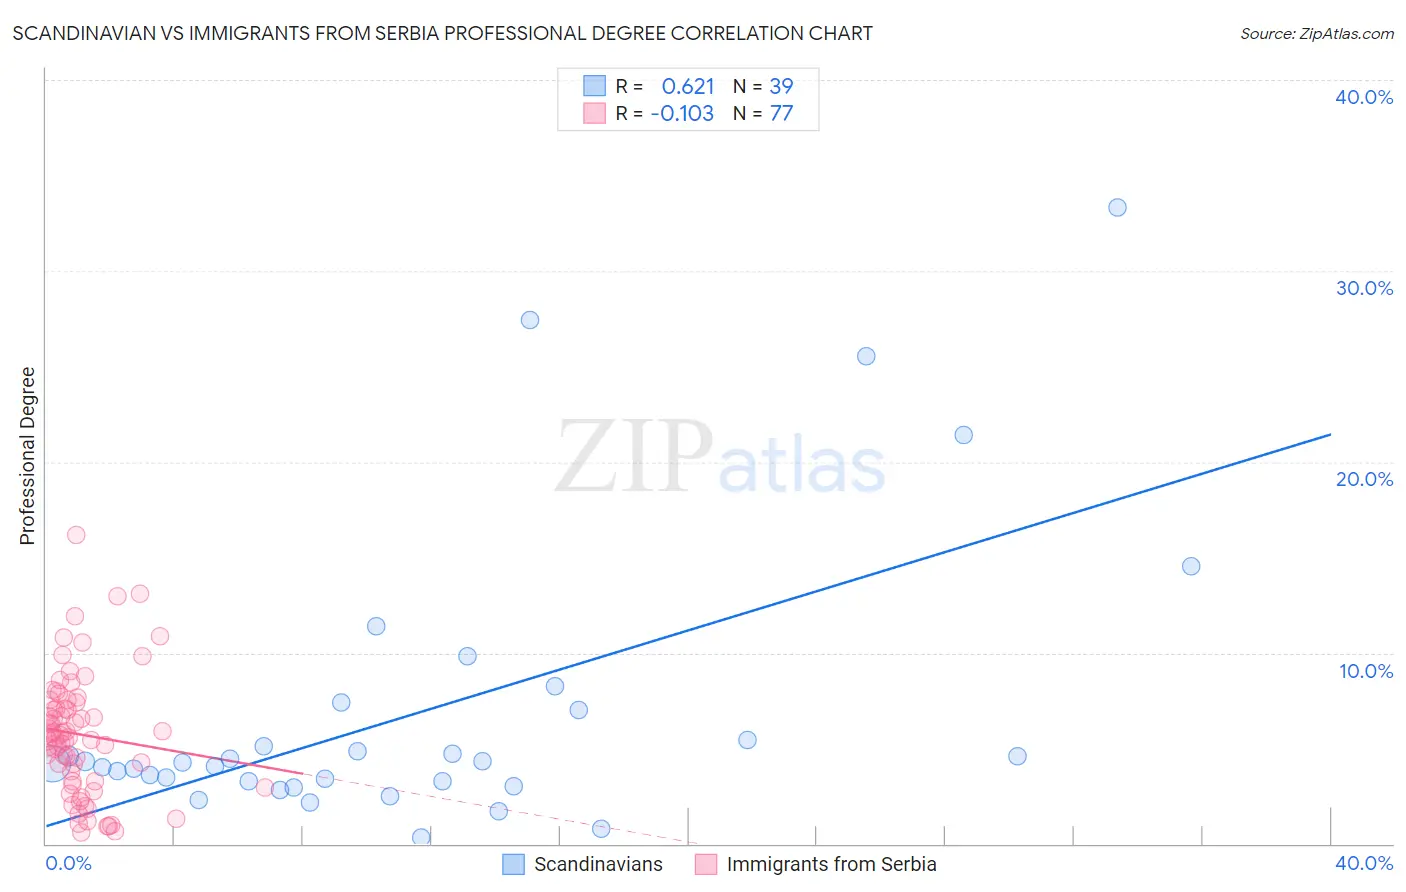
Scandinavian vs Immigrants from Serbia Professional Degree Correlation Chart
The statistical analysis conducted on geographies consisting of 469,840,840 people shows a significant positive correlation between the proportion of Scandinavians and percentage of population with at least professional degree education in the United States with a correlation coefficient (R) of 0.621 and weighted average of 4.2%. Similarly, the statistical analysis conducted on geographies consisting of 131,711,422 people shows a poor negative correlation between the proportion of Immigrants from Serbia and percentage of population with at least professional degree education in the United States with a correlation coefficient (R) of -0.103 and weighted average of 5.8%, a difference of 37.2%.
Professional Degree Correlation Summary
| Measurement | Scandinavian | Immigrants from Serbia |
| Minimum | 0.33% | 0.58% |
| Maximum | 33.3% | 16.2% |
| Range | 33.0% | 15.6% |
| Mean | 6.9% | 5.7% |
| Median | 4.2% | 5.7% |
| Interquartile 25% (IQ1) | 3.3% | 3.3% |
| Interquartile 75% (IQ3) | 7.0% | 7.5% |
| Interquartile Range (IQR) | 3.8% | 4.2% |
| Standard Deviation (Sample) | 7.5% | 3.2% |
| Standard Deviation (Population) | 7.4% | 3.2% |
Similar Demographics by Professional Degree
Demographics Similar to Scandinavians by Professional Degree
In terms of professional degree, the demographic groups most similar to Scandinavians are Nigerian (4.2%, a difference of 0.24%), French (4.2%, a difference of 0.25%), Ghanaian (4.3%, a difference of 0.29%), Spanish (4.2%, a difference of 0.57%), and Sri Lankan (4.3%, a difference of 0.62%).
| Demographics | Rating | Rank | Professional Degree |
| Immigrants | Cameroon | 33.3 /100 | #187 | Fair 4.3% |
| Immigrants | Thailand | 31.7 /100 | #188 | Fair 4.3% |
| Slovaks | 30.7 /100 | #189 | Fair 4.3% |
| Immigrants | Poland | 29.2 /100 | #190 | Fair 4.3% |
| Sri Lankans | 29.0 /100 | #191 | Fair 4.3% |
| Ghanaians | 27.3 /100 | #192 | Fair 4.3% |
| French | 27.1 /100 | #193 | Fair 4.2% |
| Scandinavians | 25.8 /100 | #194 | Fair 4.2% |
| Nigerians | 24.6 /100 | #195 | Fair 4.2% |
| Spanish | 23.0 /100 | #196 | Fair 4.2% |
| Czechoslovakians | 22.4 /100 | #197 | Fair 4.2% |
| Immigrants | Middle Africa | 22.1 /100 | #198 | Fair 4.2% |
| Norwegians | 20.5 /100 | #199 | Fair 4.2% |
| Immigrants | North Macedonia | 20.2 /100 | #200 | Fair 4.2% |
| Finns | 18.7 /100 | #201 | Poor 4.2% |
Demographics Similar to Immigrants from Serbia by Professional Degree
In terms of professional degree, the demographic groups most similar to Immigrants from Serbia are Immigrants from Greece (5.8%, a difference of 0.070%), Immigrants from Czechoslovakia (5.8%, a difference of 0.13%), Immigrants from Netherlands (5.8%, a difference of 0.23%), Immigrants from Latvia (5.8%, a difference of 0.45%), and Paraguayan (5.9%, a difference of 0.86%).
| Demographics | Rating | Rank | Professional Degree |
| Immigrants | South Central Asia | 100.0 /100 | #45 | Exceptional 5.9% |
| Immigrants | Argentina | 100.0 /100 | #46 | Exceptional 5.9% |
| Australians | 100.0 /100 | #47 | Exceptional 5.9% |
| Paraguayans | 100.0 /100 | #48 | Exceptional 5.9% |
| Immigrants | Latvia | 100.0 /100 | #49 | Exceptional 5.8% |
| Immigrants | Czechoslovakia | 100.0 /100 | #50 | Exceptional 5.8% |
| Immigrants | Greece | 100.0 /100 | #51 | Exceptional 5.8% |
| Immigrants | Serbia | 100.0 /100 | #52 | Exceptional 5.8% |
| Immigrants | Netherlands | 100.0 /100 | #53 | Exceptional 5.8% |
| Immigrants | Kuwait | 100.0 /100 | #54 | Exceptional 5.7% |
| Immigrants | Western Europe | 100.0 /100 | #55 | Exceptional 5.7% |
| Immigrants | Malaysia | 100.0 /100 | #56 | Exceptional 5.7% |
| South Africans | 100.0 /100 | #57 | Exceptional 5.7% |
| Bulgarians | 100.0 /100 | #58 | Exceptional 5.7% |
| Immigrants | Europe | 100.0 /100 | #59 | Exceptional 5.6% |