Estonian vs Immigrants from Serbia Median Male Earnings
COMPARE
Estonian
Immigrants from Serbia
Median Male Earnings
Median Male Earnings Comparison
Estonians
Immigrants from Serbia
$61,710
MEDIAN MALE EARNINGS
99.9/ 100
METRIC RATING
51st/ 347
METRIC RANK
$60,600
MEDIAN MALE EARNINGS
99.7/ 100
METRIC RATING
68th/ 347
METRIC RANK
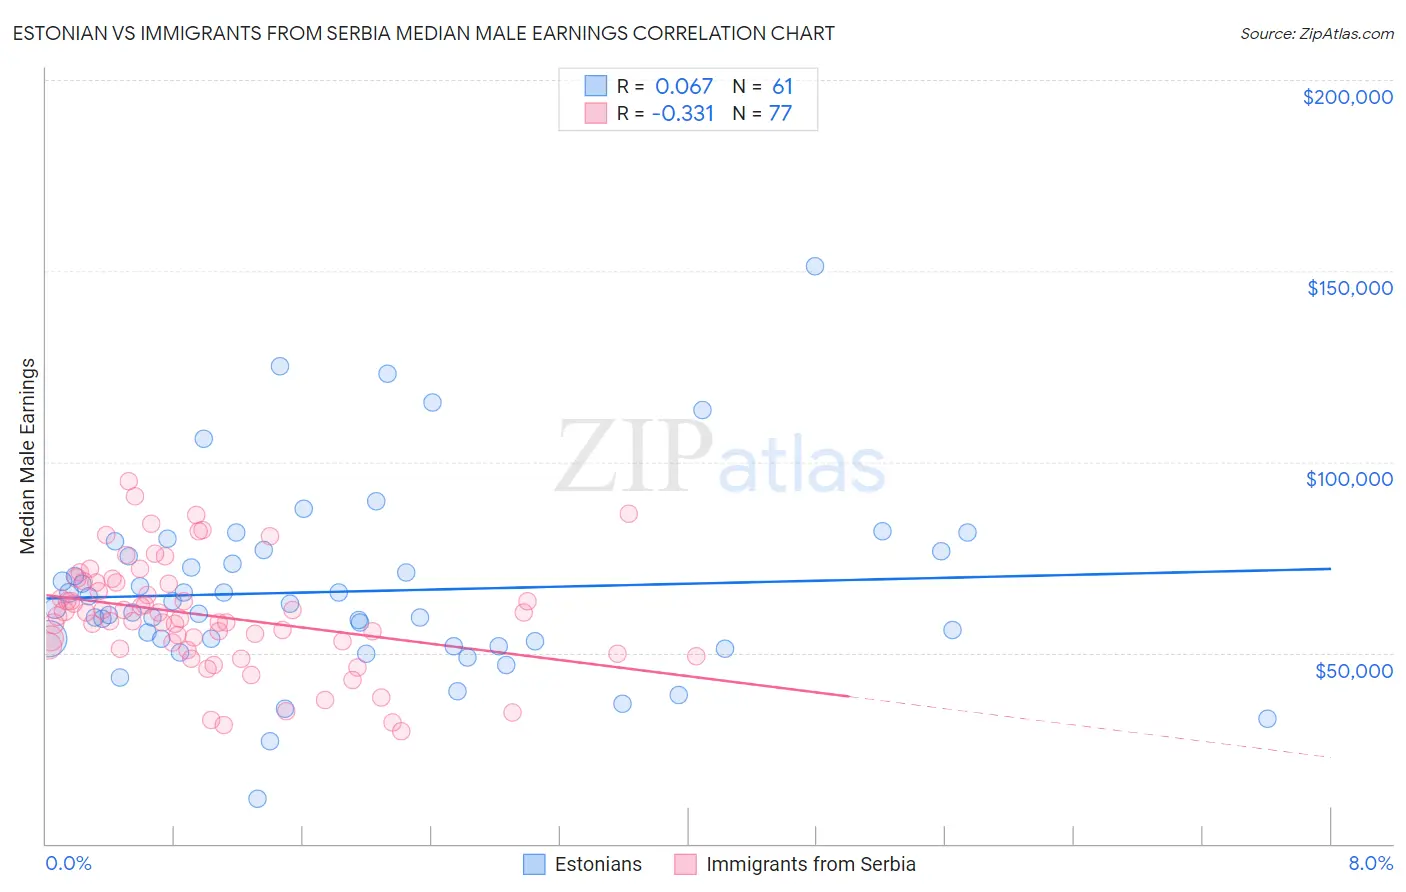
Estonian vs Immigrants from Serbia Median Male Earnings Correlation Chart
The statistical analysis conducted on geographies consisting of 123,512,238 people shows a slight positive correlation between the proportion of Estonians and median male earnings in the United States with a correlation coefficient (R) of 0.067 and weighted average of $61,710. Similarly, the statistical analysis conducted on geographies consisting of 131,723,940 people shows a mild negative correlation between the proportion of Immigrants from Serbia and median male earnings in the United States with a correlation coefficient (R) of -0.331 and weighted average of $60,600, a difference of 1.8%.
Median Male Earnings Correlation Summary
| Measurement | Estonian | Immigrants from Serbia |
| Minimum | $11,700 | $29,375 |
| Maximum | $151,311 | $94,985 |
| Range | $139,611 | $65,610 |
| Mean | $66,018 | $59,777 |
| Median | $61,673 | $59,576 |
| Interquartile 25% (IQ1) | $52,472 | $51,444 |
| Interquartile 75% (IQ3) | $76,012 | $68,411 |
| Interquartile Range (IQR) | $23,541 | $16,967 |
| Standard Deviation (Sample) | $24,287 | $14,261 |
| Standard Deviation (Population) | $24,087 | $14,168 |
Demographics Similar to Estonians and Immigrants from Serbia by Median Male Earnings
In terms of median male earnings, the demographic groups most similar to Estonians are Bhutanese ($61,759, a difference of 0.080%), Immigrants from Norway ($61,628, a difference of 0.13%), South African ($61,460, a difference of 0.41%), Immigrants from Latvia ($61,422, a difference of 0.47%), and Immigrants from Europe ($62,057, a difference of 0.56%). Similarly, the demographic groups most similar to Immigrants from Serbia are Immigrants from Spain ($60,750, a difference of 0.25%), Immigrants from Canada ($60,388, a difference of 0.35%), Immigrants from Croatia ($60,914, a difference of 0.52%), Immigrants from Indonesia ($60,935, a difference of 0.55%), and Immigrants from Eastern Europe ($60,958, a difference of 0.59%).
| Demographics | Rating | Rank | Median Male Earnings |
| Immigrants | Europe | 99.9 /100 | #49 | Exceptional $62,057 |
| Bhutanese | 99.9 /100 | #50 | Exceptional $61,759 |
| Estonians | 99.9 /100 | #51 | Exceptional $61,710 |
| Immigrants | Norway | 99.9 /100 | #52 | Exceptional $61,628 |
| South Africans | 99.9 /100 | #53 | Exceptional $61,460 |
| Immigrants | Latvia | 99.9 /100 | #54 | Exceptional $61,422 |
| Greeks | 99.9 /100 | #55 | Exceptional $61,242 |
| Lithuanians | 99.9 /100 | #56 | Exceptional $61,228 |
| Immigrants | Scotland | 99.9 /100 | #57 | Exceptional $61,220 |
| New Zealanders | 99.9 /100 | #58 | Exceptional $61,199 |
| Immigrants | Netherlands | 99.8 /100 | #59 | Exceptional $61,096 |
| Egyptians | 99.8 /100 | #60 | Exceptional $61,095 |
| Bolivians | 99.8 /100 | #61 | Exceptional $61,066 |
| Immigrants | Romania | 99.8 /100 | #62 | Exceptional $61,040 |
| Immigrants | Pakistan | 99.8 /100 | #63 | Exceptional $60,987 |
| Immigrants | Eastern Europe | 99.8 /100 | #64 | Exceptional $60,958 |
| Immigrants | Indonesia | 99.8 /100 | #65 | Exceptional $60,935 |
| Immigrants | Croatia | 99.8 /100 | #66 | Exceptional $60,914 |
| Immigrants | Spain | 99.8 /100 | #67 | Exceptional $60,750 |
| Immigrants | Serbia | 99.7 /100 | #68 | Exceptional $60,600 |
| Immigrants | Canada | 99.7 /100 | #69 | Exceptional $60,388 |