Creek vs Immigrants from Serbia Median Male Earnings
COMPARE
Creek
Immigrants from Serbia
Median Male Earnings
Median Male Earnings Comparison
Creek
Immigrants from Serbia
$46,594
MEDIAN MALE EARNINGS
0.0/ 100
METRIC RATING
309th/ 347
METRIC RANK
$60,600
MEDIAN MALE EARNINGS
99.7/ 100
METRIC RATING
68th/ 347
METRIC RANK
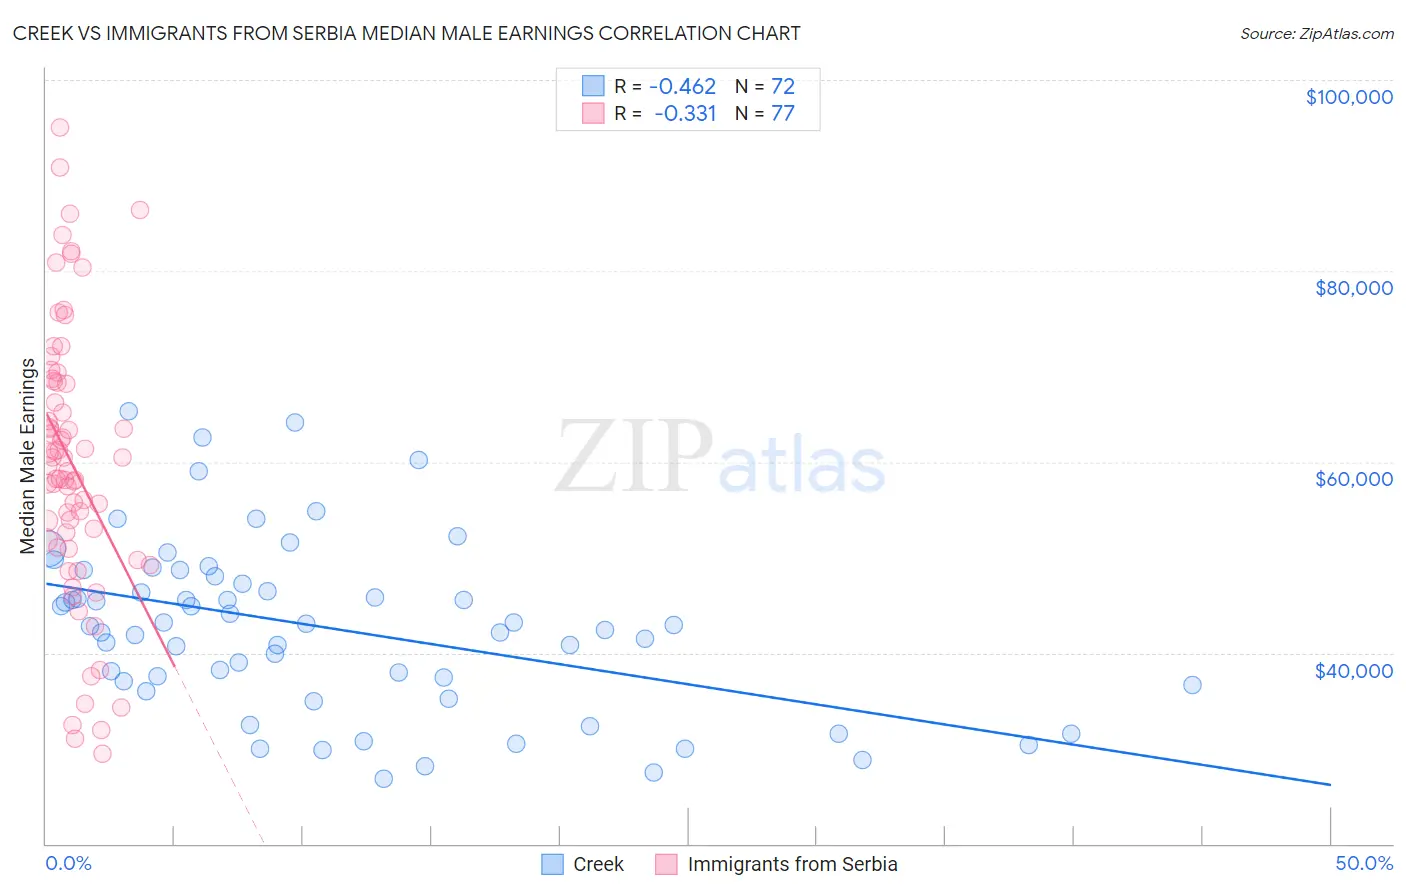
Creek vs Immigrants from Serbia Median Male Earnings Correlation Chart
The statistical analysis conducted on geographies consisting of 178,430,593 people shows a moderate negative correlation between the proportion of Creek and median male earnings in the United States with a correlation coefficient (R) of -0.462 and weighted average of $46,594. Similarly, the statistical analysis conducted on geographies consisting of 131,723,940 people shows a mild negative correlation between the proportion of Immigrants from Serbia and median male earnings in the United States with a correlation coefficient (R) of -0.331 and weighted average of $60,600, a difference of 30.1%.
Median Male Earnings Correlation Summary
| Measurement | Creek | Immigrants from Serbia |
| Minimum | $26,855 | $29,375 |
| Maximum | $65,299 | $94,985 |
| Range | $38,444 | $65,610 |
| Mean | $42,595 | $59,777 |
| Median | $42,837 | $59,576 |
| Interquartile 25% (IQ1) | $36,835 | $51,444 |
| Interquartile 75% (IQ3) | $47,588 | $68,411 |
| Interquartile Range (IQR) | $10,753 | $16,967 |
| Standard Deviation (Sample) | $8,932 | $14,261 |
| Standard Deviation (Population) | $8,870 | $14,168 |
Similar Demographics by Median Male Earnings
Demographics Similar to Creek by Median Male Earnings
In terms of median male earnings, the demographic groups most similar to Creek are Cuban ($46,580, a difference of 0.030%), Ottawa ($46,611, a difference of 0.040%), Dutch West Indian ($46,656, a difference of 0.13%), Immigrants from Dominican Republic ($46,655, a difference of 0.13%), and Guatemalan ($46,736, a difference of 0.30%).
| Demographics | Rating | Rank | Median Male Earnings |
| Seminole | 0.1 /100 | #302 | Tragic $46,783 |
| Yaqui | 0.1 /100 | #303 | Tragic $46,777 |
| Bangladeshis | 0.1 /100 | #304 | Tragic $46,744 |
| Guatemalans | 0.0 /100 | #305 | Tragic $46,736 |
| Dutch West Indians | 0.0 /100 | #306 | Tragic $46,656 |
| Immigrants | Dominican Republic | 0.0 /100 | #307 | Tragic $46,655 |
| Ottawa | 0.0 /100 | #308 | Tragic $46,611 |
| Creek | 0.0 /100 | #309 | Tragic $46,594 |
| Cubans | 0.0 /100 | #310 | Tragic $46,580 |
| Apache | 0.0 /100 | #311 | Tragic $46,429 |
| Hispanics or Latinos | 0.0 /100 | #312 | Tragic $46,419 |
| Hondurans | 0.0 /100 | #313 | Tragic $46,374 |
| Chippewa | 0.0 /100 | #314 | Tragic $46,368 |
| Immigrants | Guatemala | 0.0 /100 | #315 | Tragic $46,244 |
| Immigrants | Caribbean | 0.0 /100 | #316 | Tragic $46,193 |
Demographics Similar to Immigrants from Serbia by Median Male Earnings
In terms of median male earnings, the demographic groups most similar to Immigrants from Serbia are Immigrants from Spain ($60,750, a difference of 0.25%), Immigrants from Canada ($60,388, a difference of 0.35%), Immigrants from Bulgaria ($60,358, a difference of 0.40%), Mongolian ($60,350, a difference of 0.41%), and Immigrants from Western Europe ($60,334, a difference of 0.44%).
| Demographics | Rating | Rank | Median Male Earnings |
| Bolivians | 99.8 /100 | #61 | Exceptional $61,066 |
| Immigrants | Romania | 99.8 /100 | #62 | Exceptional $61,040 |
| Immigrants | Pakistan | 99.8 /100 | #63 | Exceptional $60,987 |
| Immigrants | Eastern Europe | 99.8 /100 | #64 | Exceptional $60,958 |
| Immigrants | Indonesia | 99.8 /100 | #65 | Exceptional $60,935 |
| Immigrants | Croatia | 99.8 /100 | #66 | Exceptional $60,914 |
| Immigrants | Spain | 99.8 /100 | #67 | Exceptional $60,750 |
| Immigrants | Serbia | 99.7 /100 | #68 | Exceptional $60,600 |
| Immigrants | Canada | 99.7 /100 | #69 | Exceptional $60,388 |
| Immigrants | Bulgaria | 99.7 /100 | #70 | Exceptional $60,358 |
| Mongolians | 99.7 /100 | #71 | Exceptional $60,350 |
| Immigrants | Western Europe | 99.7 /100 | #72 | Exceptional $60,334 |
| Immigrants | North America | 99.7 /100 | #73 | Exceptional $60,265 |
| Argentineans | 99.6 /100 | #74 | Exceptional $60,117 |
| Immigrants | Bolivia | 99.6 /100 | #75 | Exceptional $60,088 |