Scandinavian vs Burmese Median Female Earnings

COMPARE

Scandinavian
Race
Ancestry
AfghanAfricanAlaska NativeAlaskan AthabascanAlbanianAleutAlsatianAmericanApacheArabArapahoArgentineanArmenianAssyrian/Chaldean/SyriacAustralianAustrianBahamianBangladeshiBarbadianBasqueBelgianBelizeanBermudanBhutaneseBlackfeetBolivianBrazilianBritishBritish West IndianBulgarianCajunCambodianCanadianCape VerdeanCarpatho RusynCelticCentral AmericanCentral American IndianCherokeeCheyenneChickasawChileanChineseChippewaChoctawColombianColvilleComancheCosta RicanCreeCreekCroatianCrowCubanCypriotCzechCzechoslovakianDanishDelawareDominicanDutchDutch West IndianEastern EuropeanEcuadorianEgyptianEnglishEstonianEthiopianEuropeanFijianFilipinoFinnishFrenchFrench American IndianFrench CanadianGermanGerman RussianGhanaianGreekGuamanian/ChamorroGuatemalanGuyaneseHaitianHmongHonduranHopiHoumaHungarianIcelanderIndian (Asian)IndonesianInupiatIranianIraqiIrishIroquoisIsraeliItalianJamaicanJapaneseJordanianKenyanKiowaKoreanLaotianLatvianLebaneseLiberianLithuanianLumbeeLuxembourgerMacedonianMalaysianMalteseMarshalleseMenomineeMexicanMexican American IndianMongolianMoroccanNative HawaiianNavajoNepaleseNew ZealanderNicaraguanNigerianNorthern EuropeanNorwegianOkinawanOsageOttawaPaiutePakistaniPalestinianPanamanianParaguayanPennsylvania GermanPeruvianPimaPolishPortuguesePotawatomiPuebloPuerto RicanPuget Sound SalishRomanianRussianSalvadoranSamoanScandinavianScotch-IrishScottishSeminoleSenegaleseSerbianShoshoneSierra LeoneanSiouxSlavicSlovakSloveneSomaliSouth AfricanSouth AmericanSouth American IndianSoviet UnionSpaniardSpanishSpanish AmericanSpanish American IndianSri LankanSubsaharan AfricanSudaneseSwedishSwissSyrianTaiwaneseThaiTlingit-HaidaTohono O'OdhamTonganTrinidadian and TobagonianTsimshianTurkishU.S. Virgin IslanderUgandanUkrainianUruguayanUteVenezuelanVietnameseWelshWest IndianYakamaYaquiYugoslavianYumanYup'ikZimbabwean
Immigration
NonimmigrantsImmigrantsAfghanistanAfricaAlbaniaArgentinaArmeniaAsiaAustraliaAustriaBahamasBangladeshBarbadosBelarusBelgiumBelizeBoliviaBosnia and HerzegovinaBrazilBulgariaBurma/MyanmarCabo VerdeCambodiaCameroonCanadaCaribbeanCentral AmericaChileChinaColombiaCongoCosta RicaCroatiaCubaCzechoslovakiaDenmarkDominicaDominican RepublicEastern AfricaEastern AsiaEastern EuropeEcuadorEgyptEl SalvadorEnglandEritreaEthiopiaEuropeFijiFranceGermanyGhanaGreeceGrenadaGuatemalaGuyanaHaitiHondurasHong KongHungaryIndiaIndonesiaIranIraqIrelandIsraelItalyJamaicaJapanJordanKazakhstanKenyaKoreaKuwaitLaosLatin AmericaLatviaLebanonLiberiaLithuaniaMalaysiaMexicoMicronesiaMiddle AfricaMoldovaMoroccoNepalNetherlandsNicaraguaNigeriaNorth AmericaNorth MacedoniaNorthern AfricaNorthern EuropeNorwayOceaniaPakistanPanamaPeruPhilippinesPolandPortugalRomaniaRussiaSaudi ArabiaScotlandSenegalSerbiaSierra LeoneSingaporeSomaliaSouth AfricaSouth AmericaSouth Central AsiaSouth Eastern AsiaSouthern EuropeSpainSri LankaSt. Vincent and the GrenadinesSudanSwedenSwitzerlandSyriaTaiwanThailandTrinidad and TobagoTurkeyUgandaUkraineUruguayUzbekistanVenezuelaVietnamWest IndiesWestern AfricaWestern AsiaWestern EuropeYemenZaireZimbabweAzores
Burmese
Race
Ancestry
AfghanAfricanAlaska NativeAlaskan AthabascanAlbanianAleutAlsatianAmericanApacheArabArapahoArgentineanArmenianAssyrian/Chaldean/SyriacAustralianAustrianBahamianBangladeshiBarbadianBasqueBelgianBelizeanBermudanBhutaneseBlackfeetBolivianBrazilianBritishBritish West IndianBulgarianBurmeseCajunCambodianCanadianCape VerdeanCarpatho RusynCelticCentral AmericanCentral American IndianCherokeeCheyenneChickasawChileanChineseChippewaChoctawColombianColvilleComancheCosta RicanCreeCreekCroatianCrowCubanCypriotCzechCzechoslovakianDanishDelawareDominicanDutchDutch West IndianEastern EuropeanEcuadorianEgyptianEnglishEstonianEthiopianEuropeanFijianFilipinoFinnishFrenchFrench American IndianFrench CanadianGermanGerman RussianGhanaianGreekGuamanian/ChamorroGuatemalanGuyaneseHaitianHmongHonduranHopiHoumaHungarianIcelanderIndian (Asian)IndonesianInupiatIranianIraqiIrishIroquoisIsraeliItalianJamaicanJapaneseJordanianKenyanKiowaKoreanLaotianLatvianLebaneseLiberianLithuanianLumbeeLuxembourgerMacedonianMalaysianMalteseMarshalleseMenomineeMexicanMexican American IndianMongolianMoroccanNative HawaiianNavajoNepaleseNew ZealanderNicaraguanNigerianNorthern EuropeanNorwegianOkinawanOsageOttawaPaiutePakistaniPalestinianPanamanianParaguayanPennsylvania GermanPeruvianPimaPolishPortuguesePotawatomiPuebloPuerto RicanPuget Sound SalishRomanianRussianSalvadoranSamoanScotch-IrishScottishSeminoleSenegaleseSerbianShoshoneSierra LeoneanSiouxSlavicSlovakSloveneSomaliSouth AfricanSouth AmericanSouth American IndianSoviet UnionSpaniardSpanishSpanish AmericanSpanish American IndianSri LankanSubsaharan AfricanSudaneseSwedishSwissSyrianTaiwaneseThaiTlingit-HaidaTohono O'OdhamTonganTrinidadian and TobagonianTsimshianTurkishU.S. Virgin IslanderUgandanUkrainianUruguayanUteVenezuelanVietnameseWelshWest IndianYakamaYaquiYugoslavianYumanYup'ikZimbabwean
Immigration
NonimmigrantsImmigrantsAfghanistanAfricaAlbaniaArgentinaArmeniaAsiaAustraliaAustriaBahamasBangladeshBarbadosBelarusBelgiumBelizeBoliviaBosnia and HerzegovinaBrazilBulgariaBurma/MyanmarCabo VerdeCambodiaCameroonCanadaCaribbeanCentral AmericaChileChinaColombiaCongoCosta RicaCroatiaCubaCzechoslovakiaDenmarkDominicaDominican RepublicEastern AfricaEastern AsiaEastern EuropeEcuadorEgyptEl SalvadorEnglandEritreaEthiopiaEuropeFijiFranceGermanyGhanaGreeceGrenadaGuatemalaGuyanaHaitiHondurasHong KongHungaryIndiaIndonesiaIranIraqIrelandIsraelItalyJamaicaJapanJordanKazakhstanKenyaKoreaKuwaitLaosLatin AmericaLatviaLebanonLiberiaLithuaniaMalaysiaMexicoMicronesiaMiddle AfricaMoldovaMoroccoNepalNetherlandsNicaraguaNigeriaNorth AmericaNorth MacedoniaNorthern AfricaNorthern EuropeNorwayOceaniaPakistanPanamaPeruPhilippinesPolandPortugalRomaniaRussiaSaudi ArabiaScotlandSenegalSerbiaSierra LeoneSingaporeSomaliaSouth AfricaSouth AmericaSouth Central AsiaSouth Eastern AsiaSouthern EuropeSpainSri LankaSt. Vincent and the GrenadinesSudanSwedenSwitzerlandSyriaTaiwanThailandTrinidad and TobagoTurkeyUgandaUkraineUruguayUzbekistanVenezuelaVietnamWest IndiesWestern AfricaWestern AsiaWestern EuropeYemenZaireZimbabweAzores
Median Female Earnings
Income
Poverty
Unemployment
Labor Participation
Family Structure
Vehicle Availability
Education Level
Disability

Median Female Earnings Comparison

Scandinavians

Burmese

Tragic
Exceptional
$38,306
MEDIAN FEMALE EARNINGS
5.2/ 100
METRIC RATING
232nd/ 347
METRIC RANK
$44,911
MEDIAN FEMALE EARNINGS
100.0/ 100
METRIC RATING
23rd/ 347
METRIC RANK

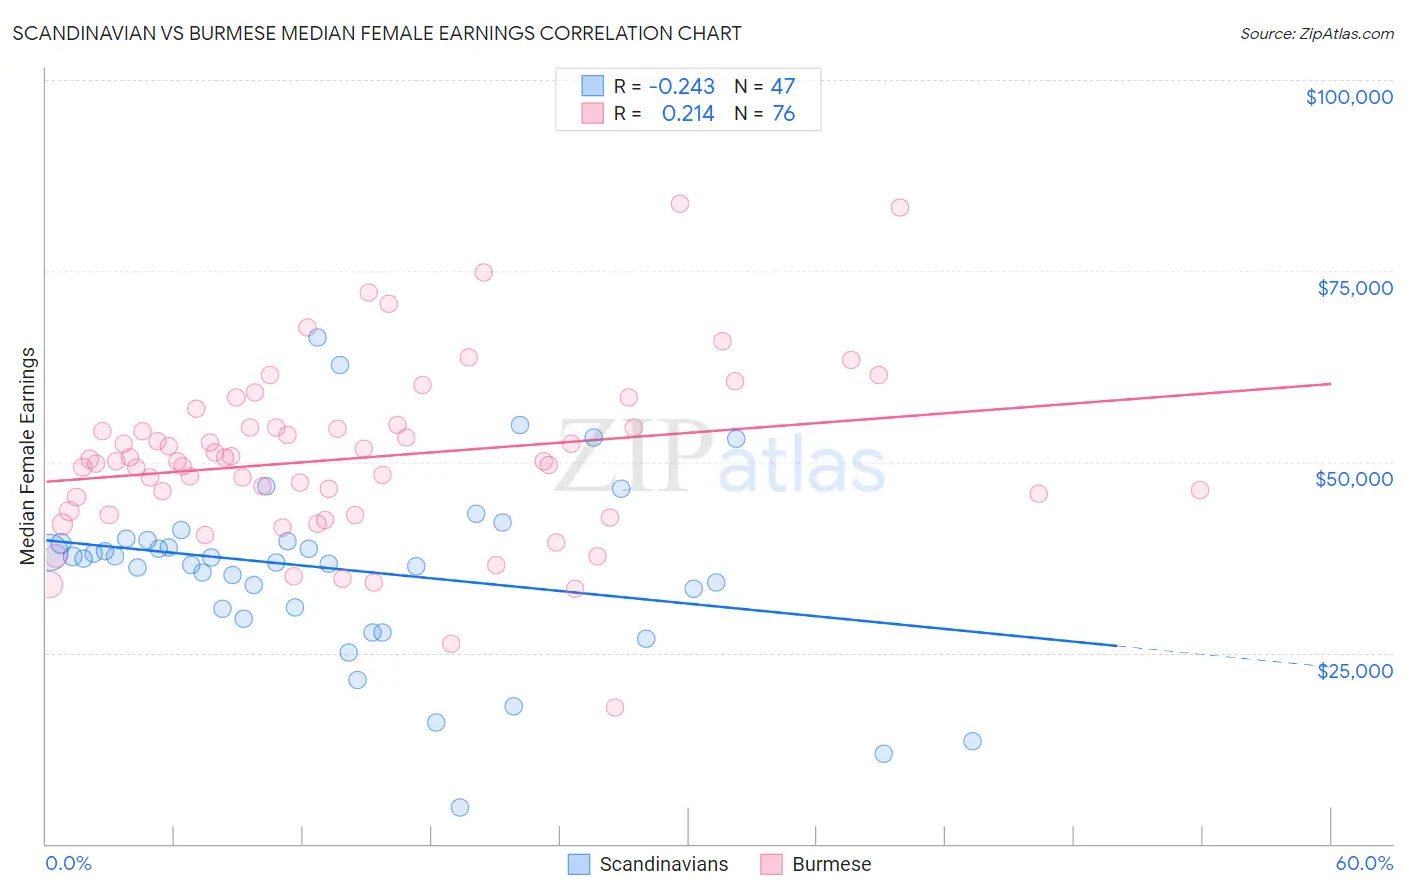
Scandinavian vs Burmese Median Female Earnings Correlation Chart

The statistical analysis conducted on geographies consisting of 472,085,070 people shows a weak negative correlation between the proportion of Scandinavians and median female earnings in the United States with a correlation coefficient (R) of -0.243 and weighted average of $38,306. Similarly, the statistical analysis conducted on geographies consisting of 465,115,174 people shows a weak positive correlation between the proportion of Burmese and median female earnings in the United States with a correlation coefficient (R) of 0.214 and weighted average of $44,911, a difference of 17.2%.
Scandinavian vs Burmese Median Female Earnings

Median Female Earnings Correlation Summary

MeasurementScandinavianBurmese
Minimum$4,824$17,769
Maximum$66,207$83,750
Range$61,383$65,981
Mean$35,901$50,485
Median$37,378$50,131
Interquartile 25% (IQ1)$30,708$43,337
Interquartile 75% (IQ3)$39,798$54,499
Interquartile Range (IQR)$9,090$11,162
Standard Deviation (Sample)$11,858$11,391
Standard Deviation (Population)$11,731$11,316

Similar Demographics by Median Female Earnings

Demographics Similar to Scandinavians by Median Female Earnings

In terms of median female earnings, the demographic groups most similar to Scandinavians are Tongan ($38,288, a difference of 0.050%), Celtic ($38,283, a difference of 0.060%), Somali ($38,333, a difference of 0.070%), Basque ($38,352, a difference of 0.12%), and Belgian ($38,382, a difference of 0.20%).
DemographicsRating | RankMedian Female Earnings
French
7.0
/100
|
#225
Tragic
$38,457
French Canadians
6.8
/100
|
#226
Tragic
$38,436
Scottish
6.3
/100
|
#227
Tragic
$38,397
Sub-Saharan Africans
6.2
/100
|
#228
Tragic
$38,391
Belgians
6.1
/100
|
#229
Tragic
$38,382
Basques
5.7
/100
|
#230
Tragic
$38,352
Somalis
5.5
/100
|
#231
Tragic
$38,333
Scandinavians
5.2
/100
|
#232
Tragic
$38,306
Tongans
5.1
/100
|
#233
Tragic
$38,288
Celtics
5.0
/100
|
#234
Tragic
$38,283
Sudanese
4.4
/100
|
#235
Tragic
$38,215
Liberians
4.4
/100
|
#236
Tragic
$38,215
Immigrants | Cabo Verde
4.3
/100
|
#237
Tragic
$38,208
Alaska Natives
4.3
/100
|
#238
Tragic
$38,202
English
4.2
/100
|
#239
Tragic
$38,196

Demographics Similar to Burmese by Median Female Earnings

In terms of median female earnings, the demographic groups most similar to Burmese are Immigrants from Greece ($44,976, a difference of 0.14%), Immigrants from Korea ($44,847, a difference of 0.14%), Cambodian ($45,014, a difference of 0.23%), Immigrants from Sweden ($44,774, a difference of 0.31%), and Immigrants from Belarus ($44,757, a difference of 0.34%).
DemographicsRating | RankMedian Female Earnings
Indians (Asian)
100.0
/100
|
#16
Exceptional
$46,481
Immigrants | South Central Asia
100.0
/100
|
#17
Exceptional
$46,324
Cypriots
100.0
/100
|
#18
Exceptional
$45,570
Eastern Europeans
100.0
/100
|
#19
Exceptional
$45,385
Immigrants | Japan
100.0
/100
|
#20
Exceptional
$45,323
Cambodians
100.0
/100
|
#21
Exceptional
$45,014
Immigrants | Greece
100.0
/100
|
#22
Exceptional
$44,976
Burmese
100.0
/100
|
#23
Exceptional
$44,911
Immigrants | Korea
100.0
/100
|
#24
Exceptional
$44,847
Immigrants | Sweden
100.0
/100
|
#25
Exceptional
$44,774
Immigrants | Belarus
100.0
/100
|
#26
Exceptional
$44,757
Turks
100.0
/100
|
#27
Exceptional
$44,695
Immigrants | Russia
100.0
/100
|
#28
Exceptional
$44,680
Immigrants | Belgium
100.0
/100
|
#29
Exceptional
$44,587
Asians
100.0
/100
|
#30
Exceptional
$44,586