Scandinavian vs Finnish Median Female Earnings
COMPARE
Scandinavian
Finnish
Median Female Earnings
Median Female Earnings Comparison
Scandinavians
Finns
$38,306
MEDIAN FEMALE EARNINGS
5.2/ 100
METRIC RATING
232nd/ 347
METRIC RANK
$38,173
MEDIAN FEMALE EARNINGS
4.0/ 100
METRIC RATING
240th/ 347
METRIC RANK
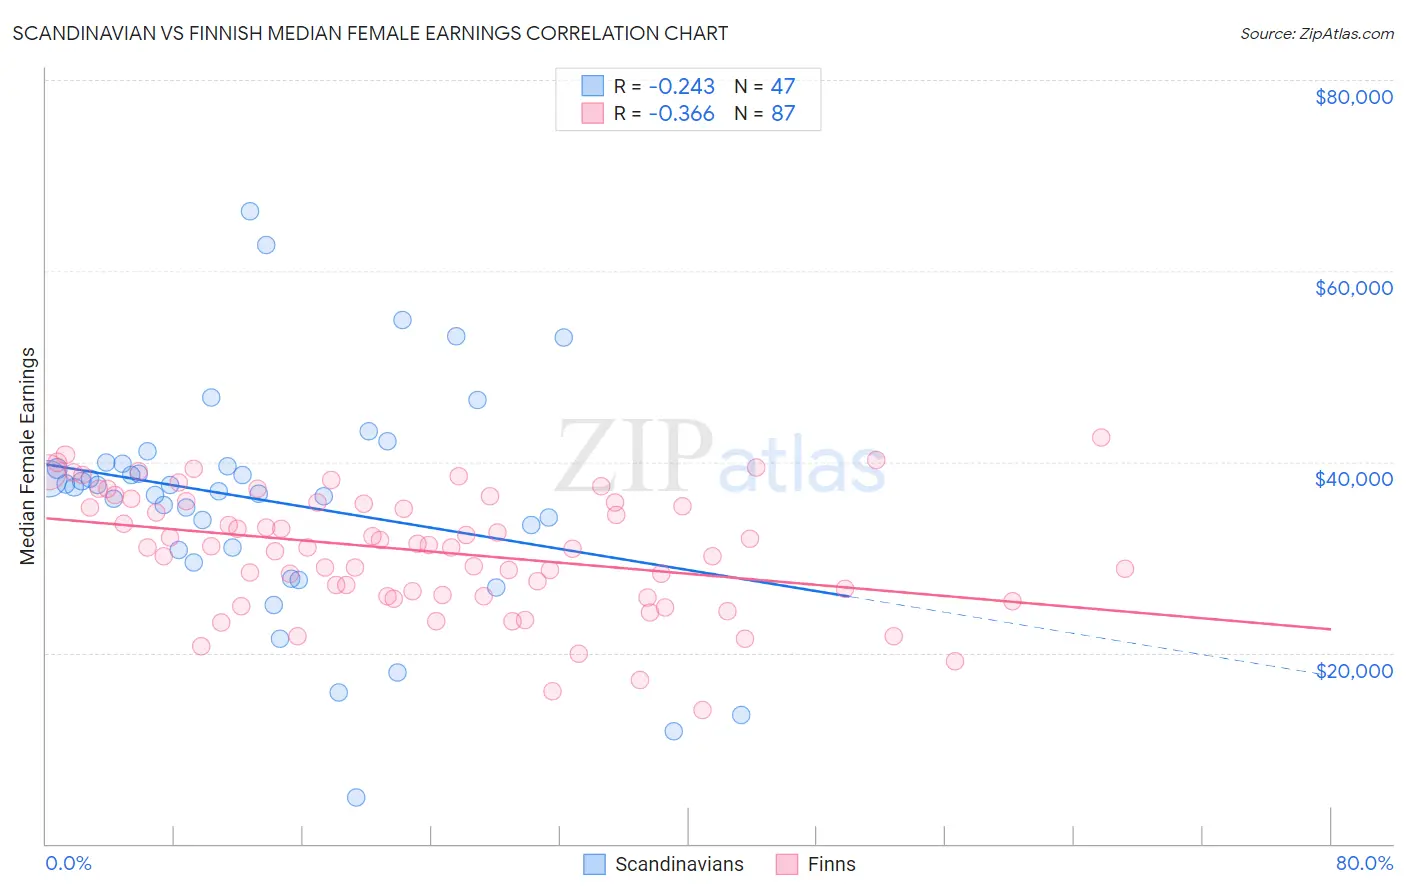
Scandinavian vs Finnish Median Female Earnings Correlation Chart
The statistical analysis conducted on geographies consisting of 472,085,070 people shows a weak negative correlation between the proportion of Scandinavians and median female earnings in the United States with a correlation coefficient (R) of -0.243 and weighted average of $38,306. Similarly, the statistical analysis conducted on geographies consisting of 404,382,146 people shows a mild negative correlation between the proportion of Finns and median female earnings in the United States with a correlation coefficient (R) of -0.366 and weighted average of $38,173, a difference of 0.35%.
Median Female Earnings Correlation Summary
| Measurement | Scandinavian | Finnish |
| Minimum | $4,824 | $14,000 |
| Maximum | $66,207 | $42,614 |
| Range | $61,383 | $28,614 |
| Mean | $35,901 | $30,656 |
| Median | $37,378 | $31,094 |
| Interquartile 25% (IQ1) | $30,708 | $25,915 |
| Interquartile 75% (IQ3) | $39,798 | $35,736 |
| Interquartile Range (IQR) | $9,090 | $9,822 |
| Standard Deviation (Sample) | $11,858 | $6,298 |
| Standard Deviation (Population) | $11,731 | $6,261 |
Demographics Similar to Scandinavians and Finns by Median Female Earnings
In terms of median female earnings, the demographic groups most similar to Scandinavians are Tongan ($38,288, a difference of 0.050%), Celtic ($38,283, a difference of 0.060%), Somali ($38,333, a difference of 0.070%), Basque ($38,352, a difference of 0.12%), and Belgian ($38,382, a difference of 0.20%). Similarly, the demographic groups most similar to Finns are English ($38,196, a difference of 0.060%), Alaska Native ($38,202, a difference of 0.080%), Immigrants from Cabo Verde ($38,208, a difference of 0.090%), Sudanese ($38,215, a difference of 0.11%), and Liberian ($38,215, a difference of 0.11%).
| Demographics | Rating | Rank | Median Female Earnings |
| French Canadians | 6.8 /100 | #226 | Tragic $38,436 |
| Scottish | 6.3 /100 | #227 | Tragic $38,397 |
| Sub-Saharan Africans | 6.2 /100 | #228 | Tragic $38,391 |
| Belgians | 6.1 /100 | #229 | Tragic $38,382 |
| Basques | 5.7 /100 | #230 | Tragic $38,352 |
| Somalis | 5.5 /100 | #231 | Tragic $38,333 |
| Scandinavians | 5.2 /100 | #232 | Tragic $38,306 |
| Tongans | 5.1 /100 | #233 | Tragic $38,288 |
| Celtics | 5.0 /100 | #234 | Tragic $38,283 |
| Sudanese | 4.4 /100 | #235 | Tragic $38,215 |
| Liberians | 4.4 /100 | #236 | Tragic $38,215 |
| Immigrants | Cabo Verde | 4.3 /100 | #237 | Tragic $38,208 |
| Alaska Natives | 4.3 /100 | #238 | Tragic $38,202 |
| English | 4.2 /100 | #239 | Tragic $38,196 |
| Finns | 4.0 /100 | #240 | Tragic $38,173 |
| Spanish | 3.5 /100 | #241 | Tragic $38,098 |
| Immigrants | Burma/Myanmar | 3.0 /100 | #242 | Tragic $38,028 |
| Germans | 2.8 /100 | #243 | Tragic $37,986 |
| Immigrants | Liberia | 2.7 /100 | #244 | Tragic $37,970 |
| Immigrants | Middle Africa | 2.7 /100 | #245 | Tragic $37,965 |
| Delaware | 2.6 /100 | #246 | Tragic $37,964 |