Samoan vs Comanche Median Earnings
COMPARE
Samoan
Comanche
Median Earnings
Median Earnings Comparison
Samoans
Comanche
$44,206
MEDIAN EARNINGS
4.2/ 100
METRIC RATING
241st/ 347
METRIC RANK
$41,519
MEDIAN EARNINGS
0.1/ 100
METRIC RATING
289th/ 347
METRIC RANK
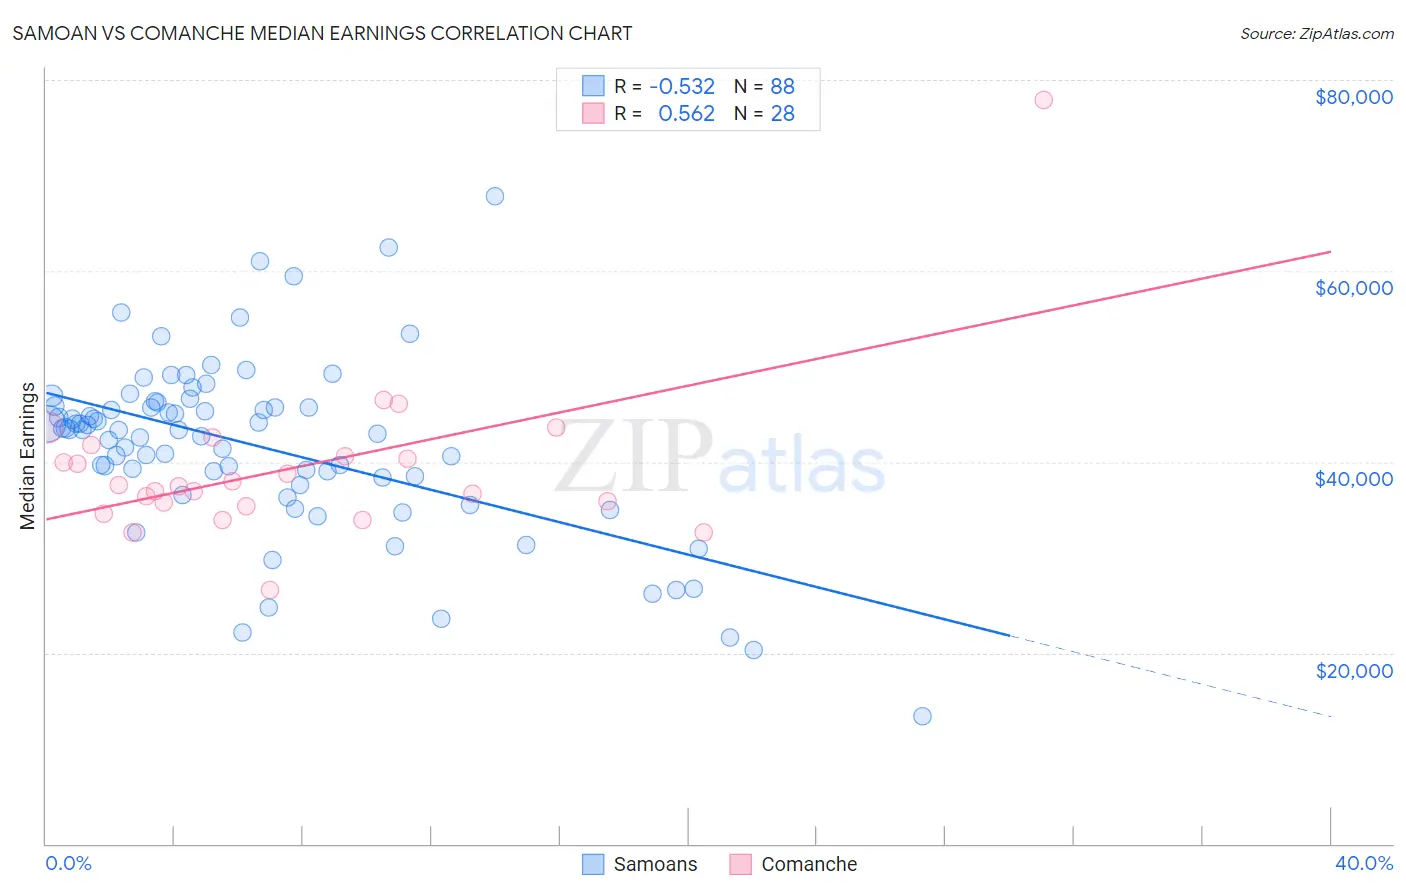
Samoan vs Comanche Median Earnings Correlation Chart
The statistical analysis conducted on geographies consisting of 225,197,093 people shows a substantial negative correlation between the proportion of Samoans and median earnings in the United States with a correlation coefficient (R) of -0.532 and weighted average of $44,206. Similarly, the statistical analysis conducted on geographies consisting of 109,778,903 people shows a substantial positive correlation between the proportion of Comanche and median earnings in the United States with a correlation coefficient (R) of 0.562 and weighted average of $41,519, a difference of 6.5%.
Median Earnings Correlation Summary
| Measurement | Samoan | Comanche |
| Minimum | $13,413 | $26,595 |
| Maximum | $67,875 | $77,937 |
| Range | $54,462 | $51,342 |
| Mean | $41,589 | $39,371 |
| Median | $43,332 | $37,513 |
| Interquartile 25% (IQ1) | $37,950 | $35,556 |
| Interquartile 75% (IQ3) | $45,824 | $41,131 |
| Interquartile Range (IQR) | $7,874 | $5,575 |
| Standard Deviation (Sample) | $9,289 | $8,724 |
| Standard Deviation (Population) | $9,236 | $8,566 |
Similar Demographics by Median Earnings
Demographics Similar to Samoans by Median Earnings
In terms of median earnings, the demographic groups most similar to Samoans are Aleut ($44,241, a difference of 0.080%), Immigrants from Venezuela ($44,163, a difference of 0.10%), Subsaharan African ($44,118, a difference of 0.20%), Nonimmigrants ($44,117, a difference of 0.20%), and Senegalese ($44,373, a difference of 0.38%).
| Demographics | Rating | Rank | Median Earnings |
| Cape Verdeans | 7.5 /100 | #234 | Tragic $44,640 |
| Venezuelans | 6.9 /100 | #235 | Tragic $44,580 |
| British West Indians | 6.7 /100 | #236 | Tragic $44,552 |
| Immigrants | Ecuador | 5.9 /100 | #237 | Tragic $44,462 |
| Sudanese | 5.6 /100 | #238 | Tragic $44,419 |
| Senegalese | 5.3 /100 | #239 | Tragic $44,373 |
| Aleuts | 4.4 /100 | #240 | Tragic $44,241 |
| Samoans | 4.2 /100 | #241 | Tragic $44,206 |
| Immigrants | Venezuela | 4.0 /100 | #242 | Tragic $44,163 |
| Sub-Saharan Africans | 3.7 /100 | #243 | Tragic $44,118 |
| Immigrants | Nonimmigrants | 3.7 /100 | #244 | Tragic $44,117 |
| Immigrants | Burma/Myanmar | 3.2 /100 | #245 | Tragic $43,998 |
| Immigrants | West Indies | 3.1 /100 | #246 | Tragic $43,989 |
| Immigrants | Cabo Verde | 3.0 /100 | #247 | Tragic $43,963 |
| Nepalese | 2.6 /100 | #248 | Tragic $43,860 |
Demographics Similar to Comanche by Median Earnings
In terms of median earnings, the demographic groups most similar to Comanche are Paiute ($41,508, a difference of 0.030%), Immigrants from Dominican Republic ($41,554, a difference of 0.080%), Central American Indian ($41,474, a difference of 0.11%), U.S. Virgin Islander ($41,448, a difference of 0.17%), and Indonesian ($41,701, a difference of 0.44%).
| Demographics | Rating | Rank | Median Earnings |
| Africans | 0.2 /100 | #282 | Tragic $41,955 |
| Dominicans | 0.2 /100 | #283 | Tragic $41,864 |
| Blackfeet | 0.2 /100 | #284 | Tragic $41,822 |
| Immigrants | Nicaragua | 0.1 /100 | #285 | Tragic $41,737 |
| Mexican American Indians | 0.1 /100 | #286 | Tragic $41,719 |
| Indonesians | 0.1 /100 | #287 | Tragic $41,701 |
| Immigrants | Dominican Republic | 0.1 /100 | #288 | Tragic $41,554 |
| Comanche | 0.1 /100 | #289 | Tragic $41,519 |
| Paiute | 0.1 /100 | #290 | Tragic $41,508 |
| Central American Indians | 0.1 /100 | #291 | Tragic $41,474 |
| U.S. Virgin Islanders | 0.1 /100 | #292 | Tragic $41,448 |
| Immigrants | Zaire | 0.1 /100 | #293 | Tragic $41,325 |
| Potawatomi | 0.1 /100 | #294 | Tragic $41,288 |
| Bangladeshis | 0.1 /100 | #295 | Tragic $41,263 |
| Cherokee | 0.1 /100 | #296 | Tragic $41,252 |